
The essentials in two minutes
Take a bicycle pump: compress the air and it heats up; let it expand and it cools. That is the whole secret of this chapter. A rising bubble of air is under less and less pressure, so it expands, so it cools — always at the same rate, 1 °C every 100 m. Nothing can stop it: this is bicycle-pump physics, not weather.
The weather, for its part, decides just one thing: the temperature of the air that the bubble passes through. If the surrounding air cools quickly with height, the bubble stays warmer than it all the way — warmer, so lighter, so it accelerates: the atmosphere is unstable, and there are thermals. If the surrounding air barely cools, the bubble soon finds itself colder than its surroundings: it sinks back, and the atmosphere is stable. The whole flying day can be read in this race between two rates of cooling.
The second secret: the bubble carries water vapour, which is invisible. The more it cools, the closer it gets to the temperature at which that vapour condenses — its dew point. When it gets there, a cumulus is born. The gap at the ground between temperature and dew point gives the height of the base directly: about 120 m per degree of spread. And condensation releases heat — the cloud warms itself, which drives the climb on: it’s the cumulus turbo, and the engine of thunderstorms.
Finally, every thermal stops sooner or later: either the surrounding air gently catches up with it (a soft ceiling), or an inversion — a layer that is warmer at the top than at the bottom — puts a lid on it (a concrete ceiling), or it enters its own cloud and wins a reprieve. The hiker, for their part, keeps two morning numbers in mind: the T − Td spread, which tells whether the summits will be in cloud, and the forecast depth of the clouds, which tells whether it will rain.
1.1A thin film heated from below#
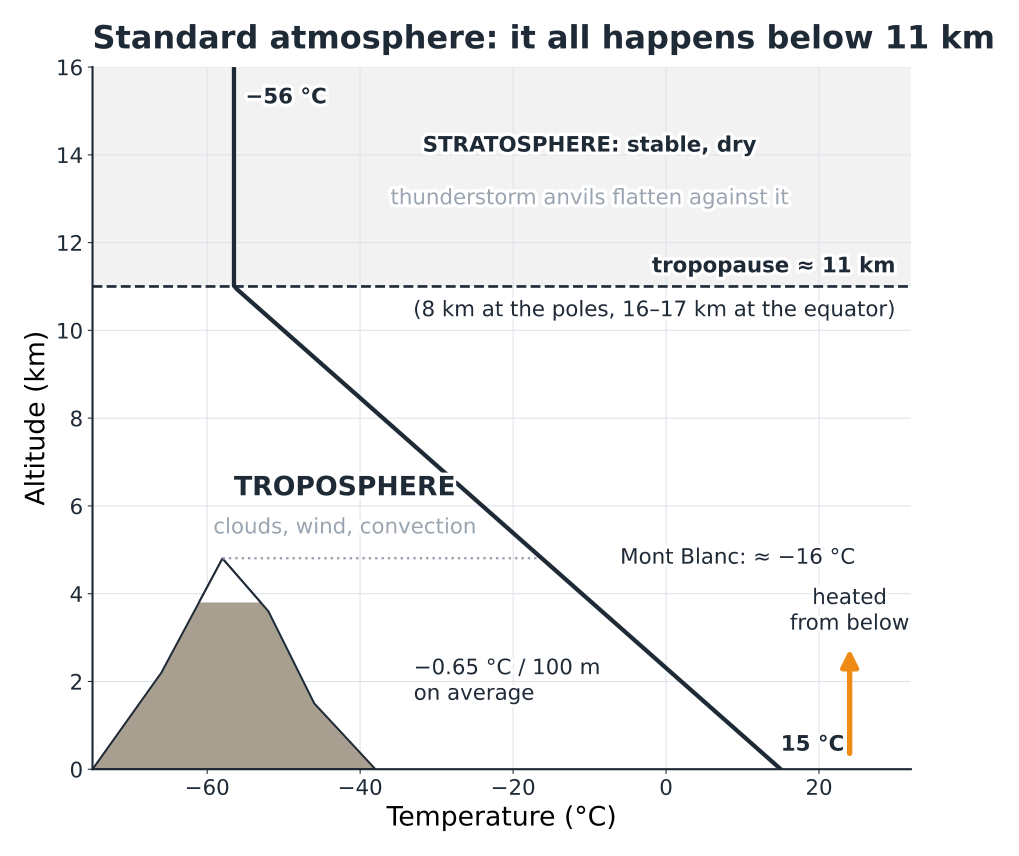
If the Earth were an orange, all the weather that concerns us would fit within the thickness of its peel. This layer is called the troposphere. It reaches from the ground up to the tropopause, at around 11 km in our latitudes — higher at the equator (16 to 17 km), lower at the poles (about 8 km), and a little lower in winter than in summer. It is the layer in which temperature falls with height and water changes state, and so the layer of clouds, wind and convection.
Above it, the stratosphere is stable and dry: the temperature stops falling there, and higher up it even rises again. No thermal can push into it for long. It is against this ceiling that the tops of cumulonimbus clouds flatten out, spreading into an anvil (Fig. 1.1).
Why it is colder higher up
A stubborn misconception holds that it is cold at altitude because you are further from the sun. In reality, sunlight passes through the air almost without warming it: it is the ground that absorbs the energy and gives it back to the air, by contact and by infrared radiation. The atmosphere is heated from below, like a saucepan on the stove. Two consequences underpin this whole book.
First, temperature decreases with height on average. The mean lapse rate is 0.65 °C / 100 m, or 6.5 °C per kilometre. But this is only a statistical average: the real profile of the day, the environment curve (section 1.6), departs from it all the time, and it is precisely this departure that makes or breaks a flying day.
Second, convection always starts from the ground. The ground warms the air in contact with it, that air becomes less dense than its neighbours and rises: that is a thermal. Free-flight weather is the science of what happens next to this bubble of air.
Hiker’s reflex
Allow 6 to 7 °C less for every 1,000 m of height gain, often more when it’s windy: 18 °C at the start in the valley means 10 to 12 °C at 2,500 m, and a much colder feel on a windy ridge. The warm jacket isn’t for the summit, it’s for the break at the summit.
1.2Pressure: the weight of the air#
The pressure at a point is the weight of the whole column of air above it. At sea level, this column weighs about 10 tonnes per square metre, which gives the standard value of 1013.25 hPa. As you climb, there is less air above you: the pressure falls.
It doesn’t fall evenly. Air is compressible: the lower layers, squashed by the weight of those above, are denser. Picture a pile of duvets: the ones at the bottom are flattened, the ones at the top are fluffed up. Cut the atmosphere into six layers of equal weight: the first is 1,500 m thick, the fifth almost 5 km (Fig. 1.2).
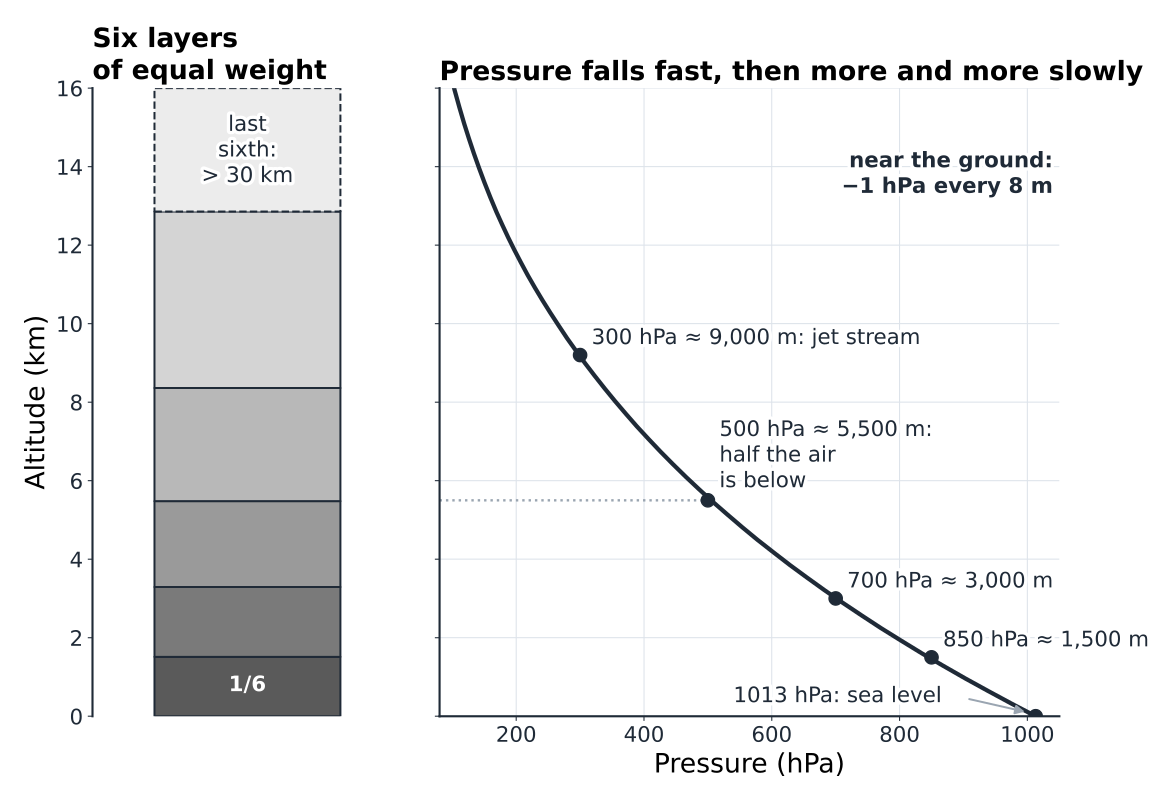
Near the ground, you lose about 1 hPa every 8 m; at around 2,000 m, it is more like 1 hPa every 10 m. The pressure is halved at about 5,500 m. That is why meteorologists describe altitude by pressure levels, which you will find on every chart and every sounding:
| Level | Approximate altitude | What to look at there |
|---|---|---|
| 850 hPa | ≈ 1,500 m | The “free” air, just above the effects of the ground: temperature, humidity, low-level wind. |
| 700 hPa | ≈ 3,000 m | The level of the Alpine ridges: wind over the summits, mid-level humidity. |
| 500 hPa | ≈ 5,500 m | The level that steers frontal systems; cold air aloft = instability. |
| 300 hPa | ≈ 9,000 m | The jet stream. |
These altitudes vary by a few tens to a few hundreds of metres depending on the temperature of the air: a warm column is thicker than a cold one. This is in fact valuable information, put to use in chapter 5.
Your altimeter is a barometer
The altimeter on your watch, your GPS or your harness does not measure altitude: it measures pressure and converts it into altitude according to the standard atmosphere. If the pressure drops by 5 hPa overnight because a low is approaching, the altimeter “climbs” by fifty metres or so without you having moved.
In flight
Set your altimeter to the known elevation of launch just before you take off (that is the day’s QNH setting), not the evening before. A 50 m error at the ceiling hardly matters; in airspace with an upper limit, on the other hand, it does, and when you come into a mountain landing field just above the treetops, a badly set altimeter will mislead you.
Hiker’s reflex
At the mountain hut, note the altitude displayed in the evening and compare it when you wake up. If your watch shows 40 to 60 m more although you slept in the same place, the pressure has dropped by 4 to 6 hPa: a classic sign of deterioration on its way. If the displayed altitude keeps rising through the morning, that is one more reason to cut the day short.
1.3Humidity and dew point#
Air always contains water vapour, an invisible gas. The maximum amount it can hold depends almost entirely on its temperature, and in a very non-linear way. A kilogram of air at 30 °C can hold about 27 g of vapour; at 10 °C, only 7.6 g; at −10 °C, barely 1.8 g. Every 10 °C or so, the capacity doubles (Fig. 1.3).
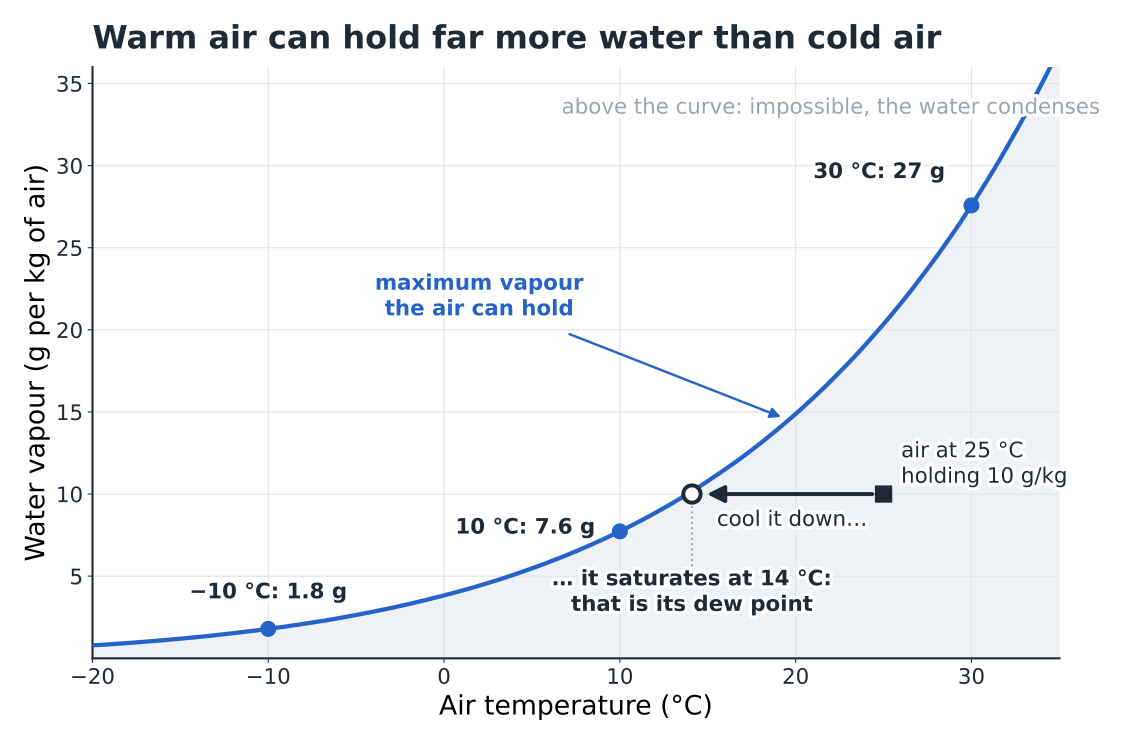
Remember the picture: cooling moist air pushes it relentlessly towards saturation. Morning fog, dew on the tent, the midday cumulus and the mist on your glasses are all the same phenomenon.
Three quantities describe humidity, and you must keep them strictly apart:
| Quantity | Definition | What it really measures |
|---|---|---|
| Relative humidity (RH, %) | Ratio of the vapour present to the maximum possible at that temperature. | How close the air is to saturation, not the amount of water. It rises when the air cools, with the water content unchanged. |
| Dew point (Td, °C) | Temperature to which the air would have to be cooled to become saturated. | The amount of vapour. It does not change when the air warms or cools without gaining or losing water. |
| Mixing ratio (r, g/kg) | Mass of vapour per kilogram of dry air. | The same information as Td, in another form. It is conserved in a rising bubble as long as no condensation occurs. |
That is why meteorologists think in Td, not in RH: saying “RH = 60%” tells you nothing until you know the temperature; saying “Td = 14 °C” fixes the amount of water once and for all. The difference T − Td, called the dew-point spread, is the quantity that matters in practice: it measures how much the air must be cooled to make a cloud.
Relative humidity goes up and down like a yo-yo
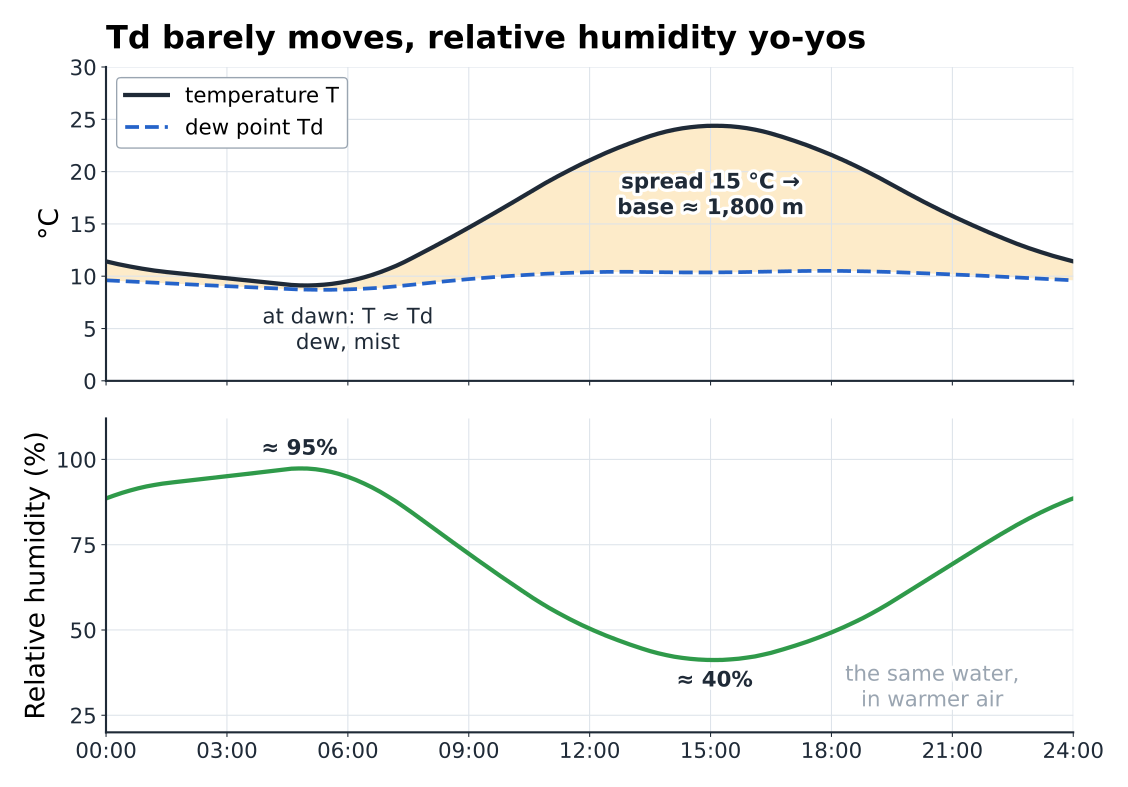
Over a fine day, the valley air neither gains nor loses much water: Td barely moves. The temperature, though, rises by 10 to 15 °C between dawn and mid-afternoon. The result: relative humidity falls from nearly 100% in the early morning to 40% or less around 15:00, then rises again in the evening (Fig. 1.4).
Pitfall
A morning at 95% relative humidity doesn’t mean a humid day: the cold night air saturates with very little water. It’s the Td you need to look at. A high Td — more than 15 °C on the plains in summer, more than 10 °C at around 1,500 m — means plenty of available water: low bases and strong potential thunderstorm energy.
1.4The bubble and the bicycle pump#
To reason it through, we follow an air parcel (also called a particle): an imaginary bubble that rises without mixing with the surrounding air and without exchanging heat with it. It’s an idealisation — we’ll see its limits — but its predictive power is remarkable.
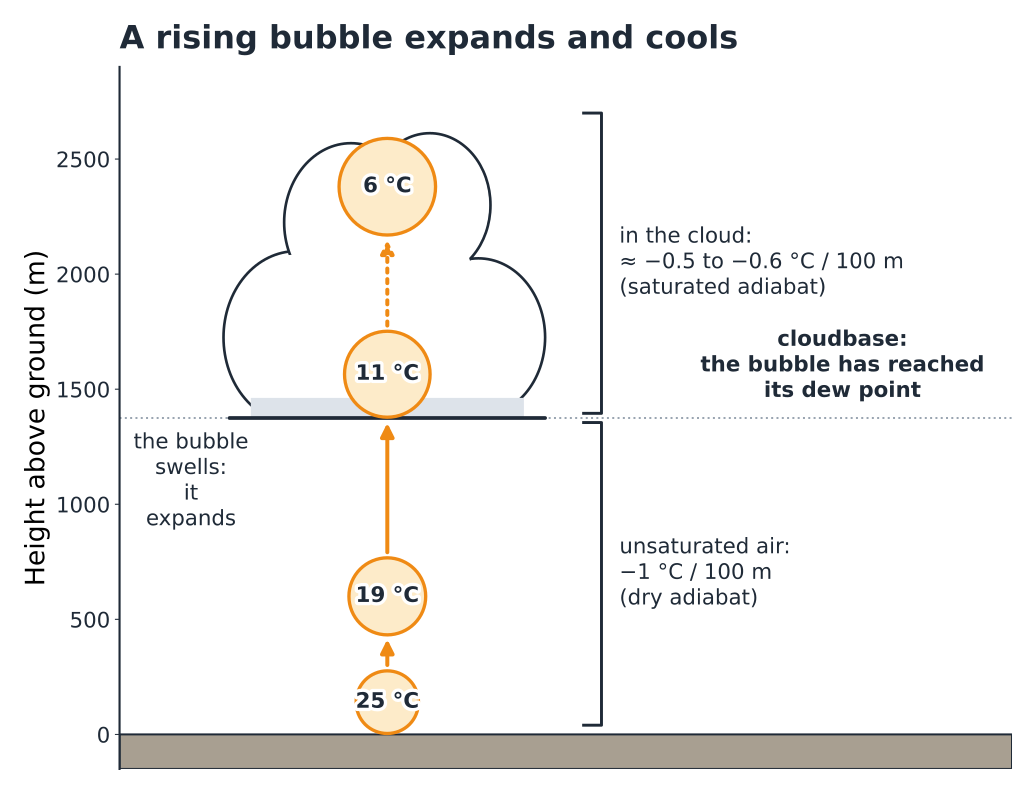
When the bubble rises, the pressure around it falls: it expands, like the air escaping from a valve. As it expands, it pushes back the air around it, and that work draws on its own energy: it cools. Conversely, the air compressed in a bicycle pump heats up. This transformation without any exchange of heat is called adiabatic. The cooling owes nothing to contact with colder air: it is purely mechanical, and its rate is a physical constant (Fig. 1.5).
The two rails
| Dry adiabat — as long as the air is not saturated | −1.0 °C / 100 m |
| Saturated adiabat (pseudo-adiabat) — in the cloud | −0.4 to −0.8 °C / 100 m (remember ≈ −0.55) |
Why?
Why is the cooling gentler on the saturated rail? Because when the vapour condenses into droplets, it gives back the heat that was needed to evaporate it: the latent heat, about 2,500 J per gram of water. This heat, given back, offsets part of the cooling caused by expansion. The saturated rate isn’t constant, either: in warm, very humid air, a lot of water condenses and the rate drops to about 0.4 °C / 100 m; in the cold air higher up, there is little water left to condense and the rate gradually approaches the dry rate.
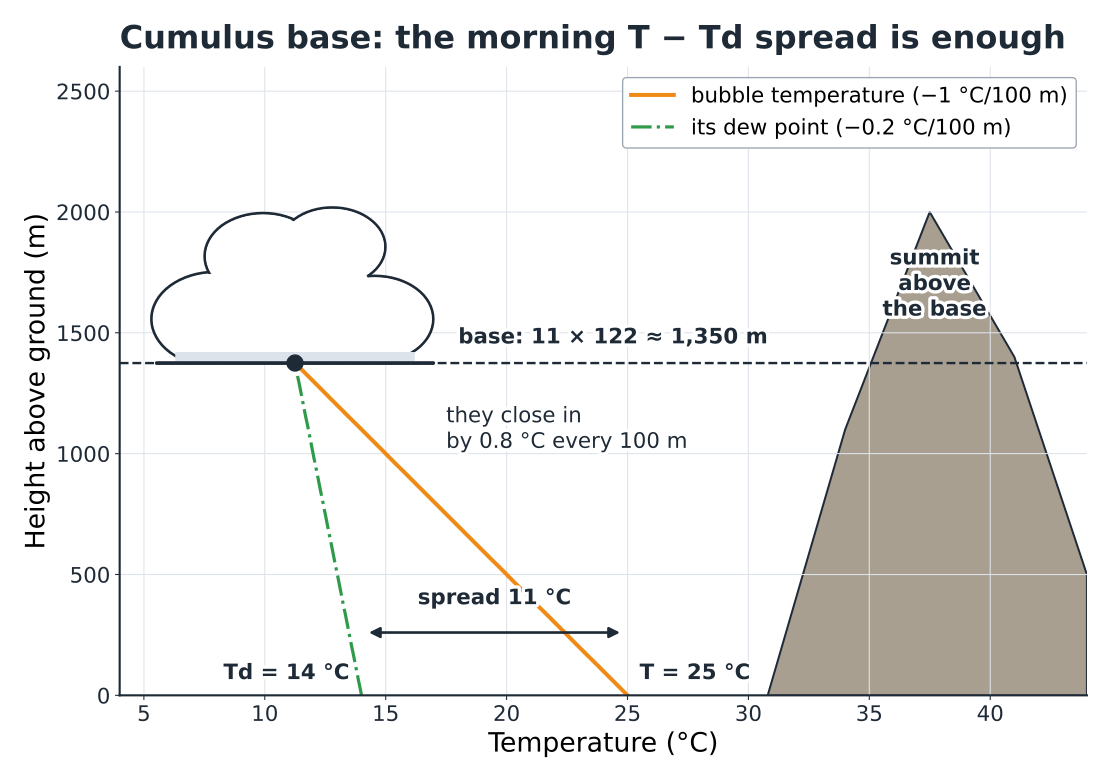
One last detail matters. The bubble’s dew point also falls a little as it rises, by about 0.2 °C / 100 m, because expansion dilutes its vapour. Its temperature and its dew point therefore close in on each other by 1.0 − 0.2 = 0.8 °C every 100 m. Remember this figure: in a moment, it will give you the height of the clouds.
1.5The cumulus base#
A bubble that leaves the ground with a T − Td spread of 11 °C catches up with its dew point after 11 / 0.8 ≈ 14 slices of 100 m, so about 1,350 m higher up. At that height it saturates: this is the condensation level, the flat base of the cumulus. All the bubbles from the same place start out in much the same way: they all condense at the same height, hence that characteristic horizontal base (Fig. 1.6).
Cumulus base (Hennig’s formula)
| Height of the base above the measuring point | ≈ 122 m × (T − Td) |
| Example: T 25 °C, Td 14 °C | 122 × 11 ≈ 1,340 m |
| Rule of thumb | ≈ 120 m per degree of spread |
Three cautions for use. The formula gives a height above the weather station: add its elevation. It holds for values measured in a standard weather screen, once the sun has already warmed things up: a spread taken at 07:00 greatly underestimates the afternoon base. Finally, it assumes that the air is well mixed from the ground to the base, which is the case as soon as the thermals are working.
In flight
The cumulus base is the usable ceiling of the day: you don’t fly into it. Take the temperature and dew point forecast for 14:00–15:00 in the valley, apply the formula, add the elevation of the station, then subtract the elevation of launch: that gives you the possible height gain. A base at 2,800 m over a launch at 1,900 m means a 900 m margin: enough to go on glide. A base at 2,100 m means a day of “scratching” under the clouds.
Hiker’s reflex
Calculated base below the height of your summit? The summit will be in cloud for part of the afternoon as soon as the cumulus form, even if the sky is blue at 08:00. As the base rises during the morning, a summit shrouded at 09:00 often clears around midday, and the reverse happens late in the day as the air cools. A T − Td spread below 3 or 4 °C first thing in the morning, with a moist westerly flow, means a day with the ridges in cloud.
Pitfall
The formula only applies to convective clouds. On a slope facing a moist flow, air forced upwards condenses much lower than the cumulus base: that is the hill fog of the prelude (Fig. P.10). And under a low inversion, cumulus never reach their theoretical base.
1.6Stable or unstable: the race between two rates of cooling#
The adiabats describe what a bubble would do if you lifted it. What remains is to know what it meets on the way: the real temperature profile of the atmosphere that day, measured by a radiosonde or calculated by the models. This is the environment curve. It follows no rail: it is the result of the air mass’s whole history — the ground warming up, cooling at night, air sinking under an anticyclone, warm or cold air brought in by the wind…
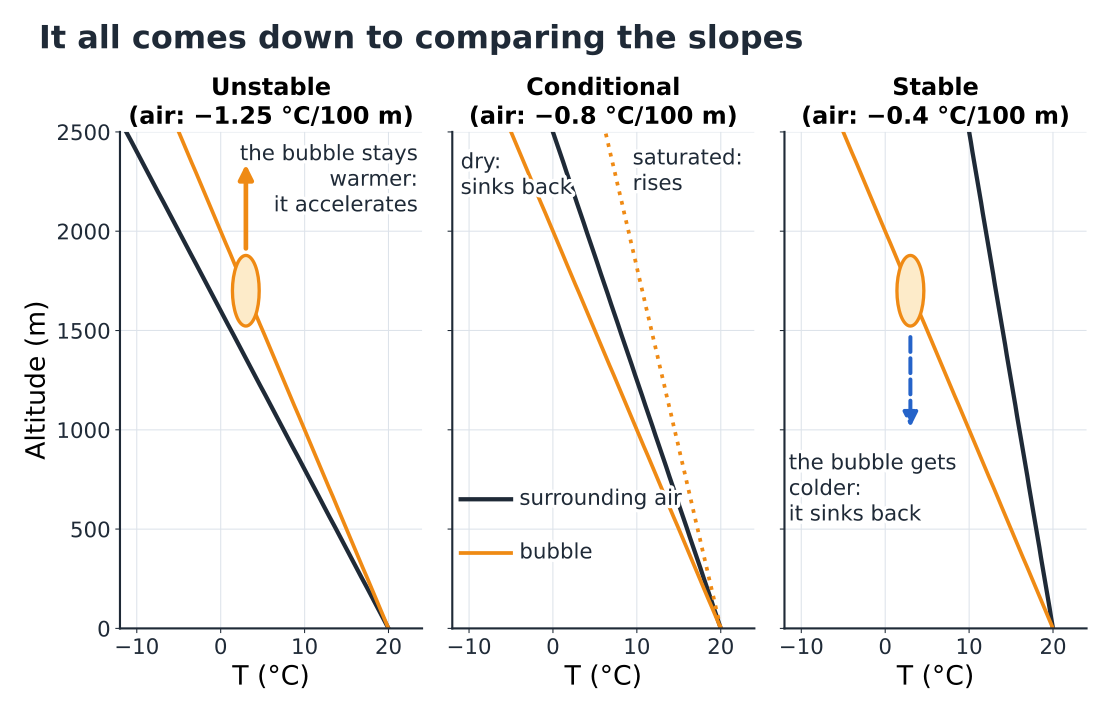
The verdict comes down to comparing slopes. Lift a bubble 100 m in your mind: it loses 1 °C. And the surrounding air, 100 m higher up — is it colder or less cold than the bubble? (Fig. 1.7)
| Lapse rate of the environment curve | Situation | What you get |
|---|---|---|
| more than 1 °C / 100 m | Absolute instability: the bubble always stays warmer. | Convection at the slightest trigger. Rare through a deep layer, common in the first few tens of metres above overheated ground. |
| between 0.55 and 1 °C / 100 m | Conditional instability: stable for a dry bubble, unstable for a saturated one. | The usual case on fine days. The condition is condensation: the cloud releases the energy. |
| less than 0.55 °C / 100 m | Absolute stability: the lifted bubble is always colder. | Any lift is slowed, then cancelled out. Smooth (laminar) air, layered cloud, haze. |
| temperature increasing with height | Inversion | A lid: nothing gets through until convection has eroded it. |
From temperature difference to vertical speed
A bubble warmer than its environment is lighter: it is pushed upwards with a force proportional to the temperature difference. A difference of 1 °C gives an acceleration of about 0.03 m/s² — three hundredths of gravity. That’s modest, but applied over 1,000 m of climb, it would in theory be enough to reach 6 to 8 m/s.
If real thermals top out between 1 and 4 m/s instead, with peaks of 5 to 8 m/s on big Alpine days, it is because of entrainment: at its edges the thermal draws in colder, drier surrounding air, which dilutes its excess heat, and it rubs against the still air around it. The narrower a thermal, the more it is diluted. A wide, well-fed thermal is protected at its core: it climbs harder and higher.
In flight
A wide, regular thermal that is easy to centre comes from a large source and will go high; a small, narrow, choppy bubble will soon run out of steam. And the steeper the lapse rate of the day’s environment curve in the low layers, the better the temperature difference holds as you climb: a “punchy” day. An almost vertical environment curve is the signature of a weak day, when you scratch.
1.7Inversions: a lid on the valley#
An inversion is a layer in which the temperature increases with height. It is stability taken to the extreme: a bubble entering it immediately becomes colder than its surroundings and sinks back. Three mechanisms create them, each with its own signature (Fig. 1.8).
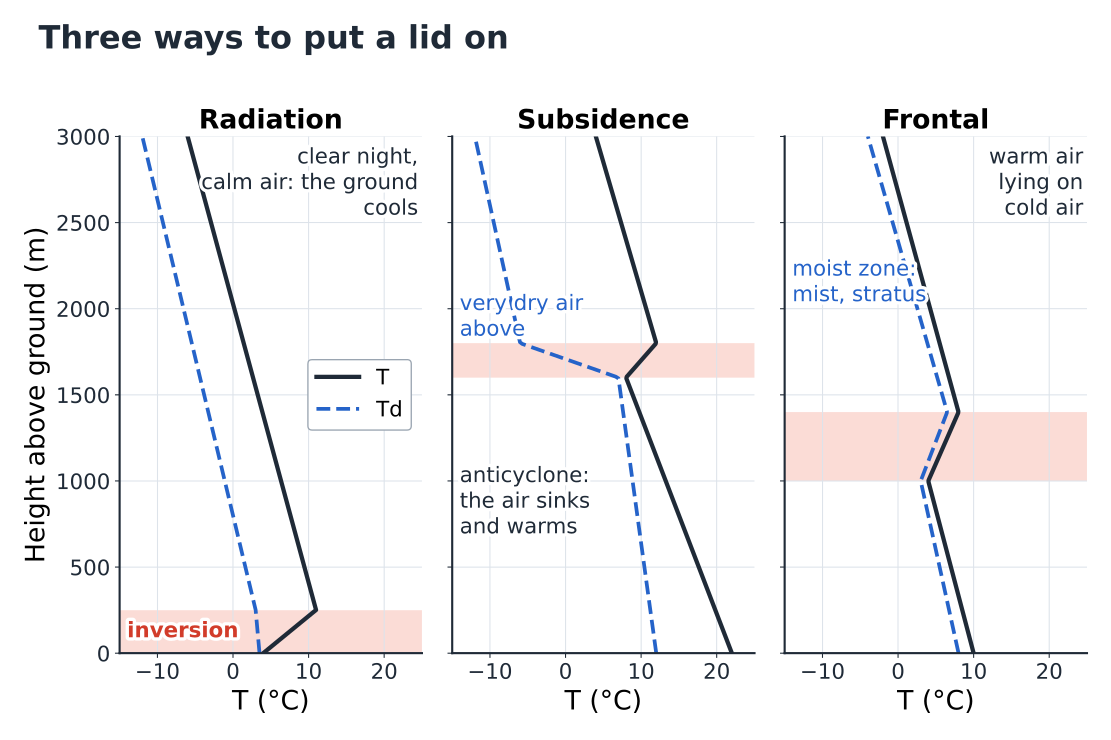
A radiation inversion forms at the ground on clear, calm nights. The ground radiates its heat out to space, cools, and cools the air in contact with it. The cold, heavy air drains away and pools on the valley floors, in a layer a few tens to a few hundreds of metres deep. In the early morning, the valley floor can be 5 to 10 °C colder than a slope 300 m higher up. The sun erodes the inversion from below in mid-morning: it is what delays the first thermals.
A subsidence inversion forms under anticyclones. The air there sinks slowly, over hundreds of kilometres; as it sinks, it is compressed and warms by 1 °C every 100 m (the bicycle pump in reverse), and it dries out. It ends up resting, warm and dry, on the cooler air of the low layers, often between 1,000 and 3,000 m. This is the lid of long spells of fine weather: blue sky, dry haze under the inversion, a capped ceiling that changes little from one day to the next and may even come down day after day as the anticyclone ages (section 3.7).
A frontal inversion forms when warm air slides up over colder air, ahead of a warm front (chapter 4). It is often moist: stratus, mist or drizzle in the cold layer, layered cloud above.
In flight
You can feel an inversion: the thermal turns choppy, the wing gets shaken about, the vario hesitates, then the lift dies abruptly. Above it, the air is often smoother, sometimes with a different wind. Under a subsidence inversion, the haze draws a very sharp horizontal line, visible from far away: that’s the ceiling of the day. In the morning at launch, a radiation inversion still in place in the valley means late, weak thermals down low: take off too early and you’ll often end up with a “sled ride”.
Hiker’s reflex
In anticyclonic winter weather, it is sometimes milder at 1,500 m than in the village. Fog or grey murk in the valley says nothing about the weather higher up: the sea of clouds in the prelude is simply an inversion made visible.
1.8The parcel method#
Everything so far can be summed up on a single graph, the emagram, on which the day’s environment curve is overlaid on the adiabatic rails. On the real document, the temperature lines slant and altitude is given as pressure; to understand it, you can “unskew” it onto temperature / altitude axes without losing anything of the method (Fig. 1.9). Chapter 2 will teach you to read the real ones.
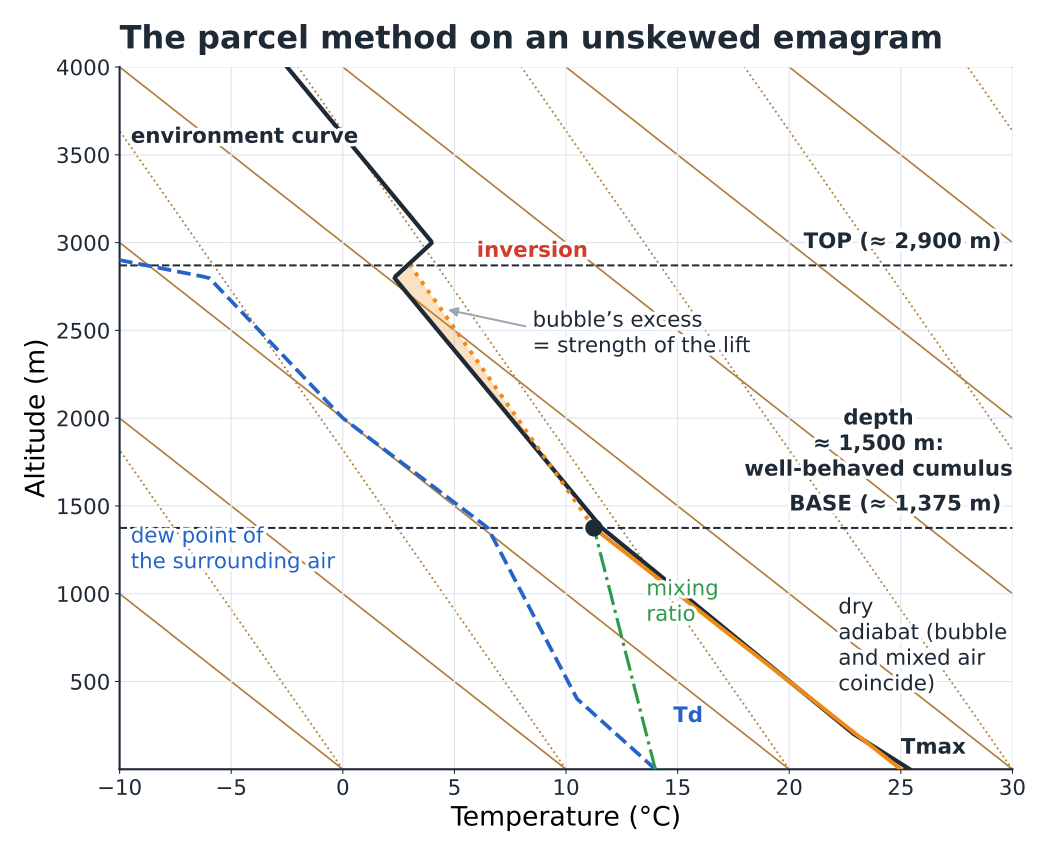
Start from the forecast maximum temperature at the ground
Climb along the dry adiabat (−1 °C / 100 m).
Start from the dew point at the ground
Climb along the line of constant mixing ratio (−0.2 °C / 100 m, almost vertical).
Where they cross is the cumulus base
This is the condensation level, the same as in section 1.5.
Above it, follow the saturated adiabat
Until it crosses the environment curve again: that is the cloud top.
Otherwise, a blue day
If the dry adiabat cuts the environment curve before reaching the base, there will be no cloud: blue thermals only, and that crossing point is the ceiling.
Two quantities sum up the diagram. The area where the bubble is warmer than the surrounding air measures the energy available for convection: the CAPE, in joules per kilogram. The area where it is colder — typically in the morning inversion — measures the energy needed to break through the lid: the CIN. A large CAPE under a CIN that holds until the middle of the day is the recipe for a late-afternoon thunderstorm outbreak: all afternoon, energy builds up under the lid, then everything goes at once.
Finally, the trigger temperature is the ground temperature from which the dry adiabat starting at the ground breaks through the nocturnal inversion. Compare it with the forecast rise in temperature through the morning: that gives you the time of the first usable thermals. And the margin between the maximum temperature and the trigger temperature tells you whether the day will be generous or sluggish.
1.9Where the thermal stops: soft ceiling, concrete ceiling#
Lift stops when the bubble is no longer warmer than the surrounding air. There are three ways for this to happen, each with a very different signature in flight (Fig. 1.10).
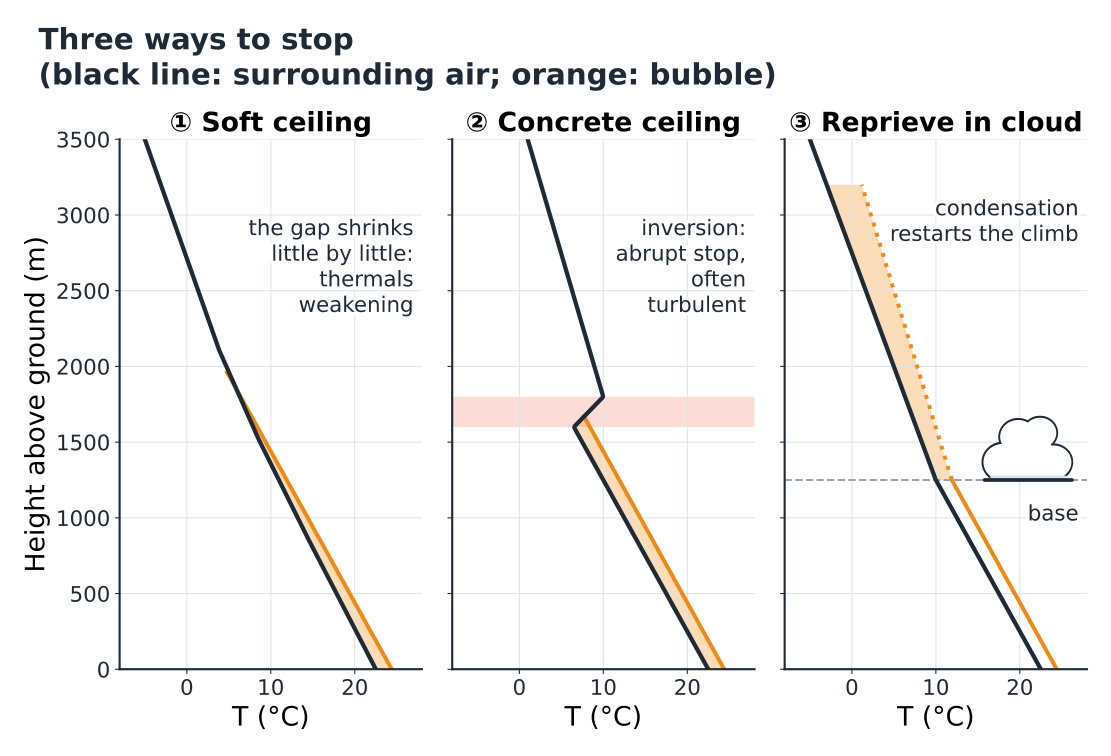
The soft ceiling is the ceiling of days with no marked lid: the surrounding air cools more and more slowly with height, and the bubble’s excess melts away gradually. In flight, the thermal widens, weakens and becomes hard to centre; with care you can still gain a few tens of metres, then nothing more.
The concrete ceiling is the ceiling of inversions: the excess disappears within a few tens of metres. The thermal climbs well right to the end, then stops abruptly, often in a choppy zone where the wing gets shaken about. Any cumulus spread out underneath it.
The reprieve in the cloud comes from latent heat: above the base, the saturated bubble loses only 0.5 to 0.6 °C per 100 m. If the surrounding air cools faster than that, the bubble becomes warmer and warmer again: the cloud climbs, sometimes very high. This is the conditional instability of section 1.6, and it is what turns a cumulus into a congestus, then into a cumulonimbus.
Two practical nuances. First, entrainment: the ceiling on the emagram is that of the ideal bubble; real, diluted thermals often top out a little lower, and only the most vigorous ones reach the theoretical ceiling. Second, the ceiling isn’t fixed: it rises through the day, as convection warms the layer and nibbles away at the inversions from below. The ceiling at 12:00 is not the ceiling at 15:00.
In flight
Under a concrete ceiling, there’s no point persisting: when the vario collapses at the same height in three thermals in a row, you’ve found the lid — go on glide. Under a cumulus base that is sucking, on the other hand, the danger is the reverse: the lift speeds up as you approach the cloud. Keep a margin of 150 to 300 m below the base, and leave the thermal by the side before you get drawn in.
1.10Latent heat, the hidden engine#
Water is the atmosphere’s great carrier of heat (Fig. 1.11). To evaporate, it borrows heat from its surroundings: that is why sweat cools you down and why damp ground warms up less than dry, stony ground. Once in the air, the vapour travels, invisible, with the thermals. When it condenses, it gives back exactly the heat it borrowed, about 2,500 J per gram of water.
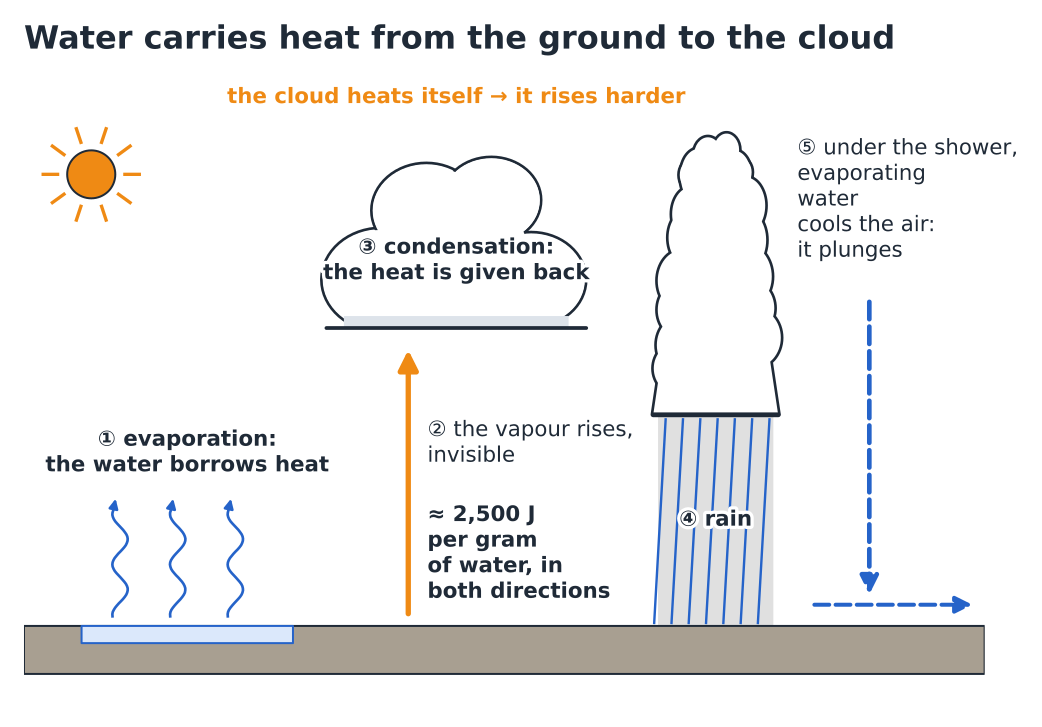
A typical value makes the effect concrete: condensing 1 gram of water in a kilogram of air warms it by about 2.5 °C. A bubble of moist air that makes a few grams of droplets as it passes through its cloud thus gets several degrees of free heating. The cloud is a heat engine that warms itself by making its own droplets: this is the fuel of cumulonimbus clouds, and the reason why a thermal picks up again when it enters its cloud.
The engine also runs in reverse. When rain falls through dry air, part of it evaporates on the way and cools the air it passes through. This cooled air, heavier, plunges towards the ground and spreads out in gusts. The drier the air below the base, the more violent the effect: high-based thunderstorms, over dry air, produce the most brutal gusts.
In flight
Two direct consequences. Under a moist, heavy cumulus base, cloud suck can become very strong: latent heat accelerates the air in the cloud and below it. And under a shower or virga, expect sink and a wind at the ground that strengthens and changes direction: it’s the worst place to land.
Hiker’s reflex
The cold blast of wind that comes before a thunderstorm downpour is this air, cooled by evaporation, spreading out at the ground. When it arrives, the rain follows within minutes. And clothing wet with sweat or rain chills you by the same mechanism: at the summit break, change or put on a layer before you get cold.
1.11Depth brings rain#
All clouds contain water, but very few produce rain. The droplets of a cumulus are a few hundredths of a millimetre across: they float. To make a raindrop, you need to bring a million of them together, and that takes time and depth. In the mid-latitudes, the most efficient route goes through ice: in the part of the cloud colder than about −10 °C, ice crystals grow at the expense of the droplets, then fall and melt as they pass through the 0 °C isotherm (Fig. 1.12).
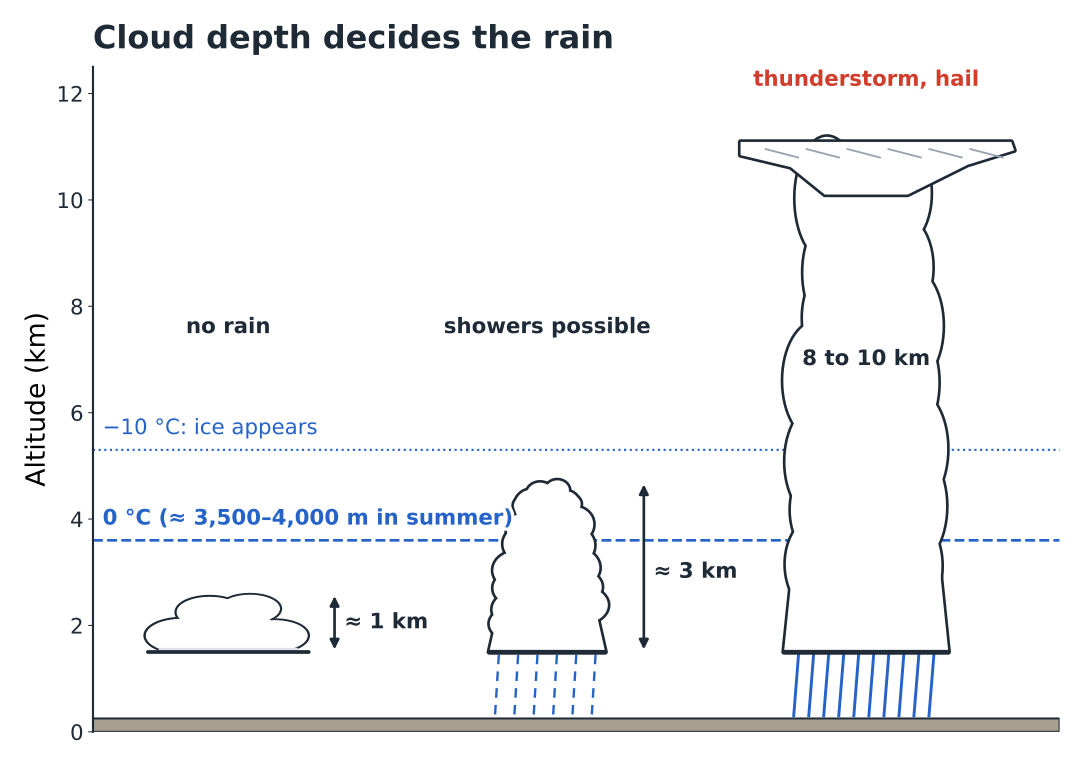
Hence a field rule, to be used as a typical value: a convective cloud less than 1,500 to 2,000 m deep almost never produces rain; beyond 3,000 m, especially if its top is colder than −10 °C, showers become likely; a cumulonimbus 8 to 10 km deep means a thunderstorm. The depth can be read on the emagram (top − base, section 1.8), and most free-flight forecast websites give it directly.
Stratiform rain — the rain of fronts, which lasts for hours over whole regions — obeys the same physics, but in deep layers lifted slowly over hundreds of kilometres: that is the business of chapter 4.
The hiker’s two questions, answered with numbers
“Will I be walking in cloud?” The base of convective clouds is the condensation level: base ≈ valley elevation + 122 × (T − Td). Compare this figure with the height of your route, bearing in mind that the base rises through the morning, that slopes facing a moist flow catch clouds lower than the calculation suggests, and that a T − Td spread of less than 4 °C first thing in the morning promises shrouded summits.
“Will it rain?” For convective rain, look at the forecast depth of the clouds and the height of the freezing level. Cumulus 1,000 m deep under a freezing level at 4,000 m: nothing. Clouds 3,000 m deep or more whose tops rise above the freezing level: showers possible in the afternoon. If, on top of that, the CAPE is high and the air is moist aloft, the risk of thunderstorms is real; in the mountains, it is decided early, and chapter 9 sets out the signs in detail.
Hiker’s reflex
In the morning, two numbers do the first sorting: T − Td (where will the base be?) and the forecast depth of the clouds (will they produce rain?). Free-flight forecast websites give both; chapter 2 teaches you to read them on a sounding.
1.12Exercises#
Your turn — the afternoon base
The forecast for the valley weather station, at 700 m, gives a temperature of 28 °C and a dew point of 12 °C for 15:00. Launch is at 1,900 m, and you are planning a hike to a summit at 2,800 m. At what height should you expect the cumulus base? What margin does the pilot have? Will the hiker be in cloud?
Show the answer
Spread 28 − 12 = 16 °C, so 16 × 122 ≈ 1,950 m above the station: base at about 700 + 1,950 ≈ 2,650 m. The pilot has about 750 m of height gain above launch, a decent day. The summit at 2,800 m is 150 m above the base: when a cumulus forms over it, it will be in cloud, on and off. In the morning, with a smaller spread, the base will be lower still.
Your turn — stable or unstable?
The forecast sounding shows the temperature going from 14 °C to 8 °C between 1,500 and 2,500 m. An unsaturated bubble leaves 1,500 m at 15 °C. When it reaches 2,500 m, is it warmer or colder than the surrounding air? What happens if it was saturated from 1,500 m upwards?
Show the answer
The surrounding air loses 6 °C in 1,000 m, i.e. 0.6 °C / 100 m. The dry bubble loses 10 °C: it arrives at 5 °C, colder than the air (8 °C) — the layer is stable for it, and the thermal dies on the way. If it were saturated, it would lose about 5.5 °C and arrive at about 9.5 °C, warmer than the air: the layer is weakly unstable for cloudy air. This is conditional instability, with a modest excess: clouds that grow slowly.
Your turn — the altimeter at the hut
At the mountain hut, at 2,400 m, your watch showed 2,400 m at 21:00. At 06:00, it shows 2,465 m. What has happened, and what do you conclude?
Show the answer
You haven’t moved: it’s the pressure that has dropped. At this altitude, 1 hPa is worth about 10 m: the drop is about 6 hPa in 9 hours, which is significant. A frontal system is probably approaching. Check the forecast, look at the sky (cirrus, halo, altostratus?) and plan a shorter objective or an earlier return.
Your turn — will it rain?
Forecast for the afternoon: cumulus base at 2,200 m, tops at 5,500 m, 0 °C isotherm at 3,800 m. A flying day and an arête route are planned. What’s your analysis?
Show the answer
Forecast depth: 5,500 − 2,200 = 3,300 m, with a top well above the 0 °C isotherm and probably colder than −10 °C. Showers are likely, and thunderstorms possible if the instability is marked. A short, early flight, landed before the first congestus. Arête route: a very early start, off the ridge before midday.
1.13Quick reference and glossary#
The chapter’s key figures
| Tropopause (mid-latitudes) | ≈ 11 km (8 to 17 km) |
| Mean lapse rate of the atmosphere | 0.65 °C / 100 m |
| Sea-level pressure | 1013 hPa |
| Pressure near the ground | −1 hPa / 8 m (≈ 10 m at around 2,000 m) |
| Reference levels | 850 ≈ 1,500 m · 700 ≈ 3,000 m · 500 ≈ 5,500 m |
| Water-vapour capacity of air | doubles every ≈ 10 °C |
| Dry adiabat | −1.0 °C / 100 m |
| Saturated adiabat | −0.4 to −0.8 °C / 100 m (≈ −0.55) |
| Dew point of the bubble | −0.2 °C / 100 m |
| T / Td convergence as the bubble rises | 0.8 °C / 100 m |
| Cumulus base | ≈ 122 m × (T − Td) |
| Unstable / stable (unsaturated air) | environment curve > 1 °C / 100 m · < 0.55 °C / 100 m |
| Buoyancy for a 1 °C difference | ≈ 0.03 m/s² |
| Typical thermals in the Alps | 1 to 4 m/s, peaks of 5 to 8 m/s |
| Latent heat | ≈ 2,500 J/g; 1 g/kg condensed ≈ +2.5 °C |
| Depth of a convective cloud that gives rain | showers possible > 2,000 m, likely > 3,000 m |
- Adiabatic
- Describes a transformation without any exchange of heat with the outside. A rising bubble cools adiabatically, simply by expanding.
- CAPE and CIN
- Energy available for convection (the area where the bubble is warmer than the surrounding air) and energy needed to break through a stable layer (the area where it is colder), in J/kg.
- Latent heat
- Heat absorbed by water as it evaporates and given back when the vapour condenses, about 2,500 J per gram.
- Environment curve
- The real profile of temperature against altitude, at a given place and time.
- Dew-point spread
- The difference T − Td: how much the air must be cooled for it to become saturated.
- Entrainment
- Mixing of surrounding air into a thermal through its edges; it dilutes the excess heat and slows the lift.
- Relative humidity
- Ratio of the vapour present to the maximum possible at the air temperature, as a percentage.
- Inversion
- Layer in which temperature increases with height; a lid on convection.
- Condensation level
- Height at which a rising bubble reaches saturation; the cumulus base. Also called the lifting condensation level (LCL).
- Parcel (or air parcel)
- Imaginary bubble of air that is followed as it rises, assuming it is isolated from its environment.
- Dew point
- Temperature to which the air would have to be cooled to become saturated; it measures the amount of vapour.
- Mixing ratio
- Mass of water vapour per kilogram of dry air, in g/kg.
- Subsidence
- Slow, large-scale sinking of air, typical of anticyclones; the air warms and dries as it sinks.
- Troposphere, tropopause
- Lowest layer of the atmosphere, in which temperature falls with height and clouds form; the tropopause is its ceiling, at around 11 km.
What to remember
- The atmosphere is heated from below: convection always starts from the ground.
- A rising bubble cools by 1 °C / 100 m as long as it is dry, and by about 0.55 °C / 100 m in the cloud. This is physics, not weather.
- The day’s weather is the environment curve: if the surrounding air cools faster than the bubble, the bubble rises (unstable); if it cools more slowly, the bubble sinks back (stable).
- Think in dew point, not in relative humidity. The T − Td spread gives the cumulus base: ≈ 122 m per degree.
- An inversion is a lid: radiation at night at the ground, subsidence under anticyclones, frontal ahead of warm fronts.
- Three ceilings: soft (the gap melts away), concrete (an inversion), reprieve (the cloud drives the climb on thanks to latent heat).
- Convective rain needs depth: less than 2,000 m, nothing; more than 3,000 m with an icy top, showers; a cumulonimbus, a thunderstorm.
End of chapter 1 · Chapter 2 puts these tools into practice on real emagrams.