
The essentials in two minutes
The emagram is a vertical X-ray of the sky: on it you read, level by level, the temperature of the air (the T curve) and its water content (the Td curve). The paper carries “rails” printed in advance — the rail of dry air, which cools by 1 °C per 100 m, and the rail of cloud, at about 0.55 °C per 100 m — and the whole method consists of rolling an imaginary bubble along these rails, then seeing where it crosses the day’s curves.
Five steps are enough. The night’s lid, brought back down to the ground, gives the temperature needed for things to get going, and so the time of the first thermals. The maximum temperature taken up the dry rail and the dew point taken up its own rail cross at the cumulus base. The cloud rail leads to the cloud tops. The depth of the clouds tells you whether it might rain; the gap between the bubble and the air tells you the strength of the thermals. Finally, you look at what could go wrong: a lid, moisture aloft, wind.
Two energy meters complete the picture: the CIN, the toll to pay before the air rises on its own, and the CAPE, the fuel available (above about 1,000 J/kg, thunderstorms are on the cards). And two nuances make an independent pilot: a sounding from a valley floor underestimates the ceiling over a large massif, and a sounding must always be cross-checked against the real sky. Nearly all summer soundings fall into four faces — blue, well-behaved cumulus, overdevelopment, low inversion — and the emagram becomes something you read at a glance.
2.1An X-ray of the sky#
Imagine releasing a balloon fitted with a thermometer and a hygrometer, and noting, every hundred metres, the temperature and humidity of the air it passes through. Plot these measurements on a graph — altitude going up, temperature going across — and you get a sounding. Radiosondes do this twice a day; forecast models calculate it for every hour and every point on the map.
The graph that holds these measurements is called an emagram. Its virtue: it carries, printed in advance, the paths that a lifted bubble of air would follow. All you have to do is compare the bubble with the air around it, as in chapter 1, but at a single glance over the whole height of the sky.
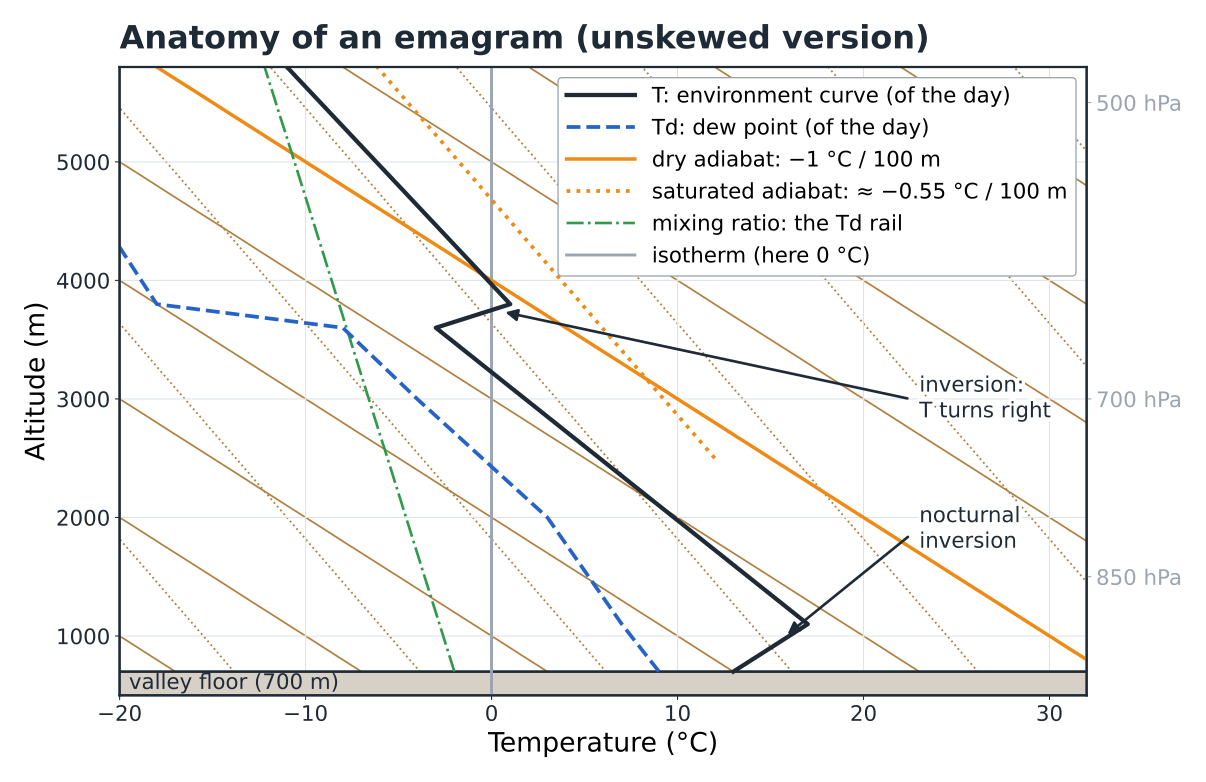
A real emagram is intimidating because several families of lines cross on it (Fig. 2.1). The key: you never use more than two of them at a time.
| Line | Appearance | Used for |
|---|---|---|
| Altitudes / isobars | Horizontal, in metres or in hPa | Finding your bearings: 850 hPa ≈ 1,500 m, 700 hPa ≈ 3,000 m, 500 hPa ≈ 5,500 m |
| Isotherms | Vertical here; slanting on “skew-T” diagrams | Reading a temperature |
| Dry adiabats | The most slanted, solid orange | Rail of the unsaturated bubble: −1 °C / 100 m |
| Saturated adiabats | More upright, dotted orange | Rail in the cloud: ≈ −0.55 °C / 100 m (0.4 to 0.8 depending on the temperature) |
| Mixing-ratio lines | Almost vertical, green dash-dot | Rail of the bubble’s dew point: ≈ −0.2 °C / 100 m |
On top of these rails come the only two curves of the day: the environment curve T, as a solid line, and the dew-point curve Td, dashed, always to its left.
Why do some emagrams have skewed isotherms?
Purely for ease of reading. On the diagrams of forecast websites (“skew-T”), the isotherms are tilted at 45°: this widens the angle between the environment curve and the adiabats. This book uses an “unskewed” version, with temperature laid flat and altitude in metres, which is easier to learn. The steps are identical: on a skew-T, you follow the same rails, drawn at a slant.
Your first reflex in front of any emagram, before any calculation: three readings by eye.
1. The gap between T and Td. Curves close together: moist air (low cloud, veil, summits in cloud). Curves far apart: dry air (high bases, blue sky).
2. The slope of T, compared with the neighbouring adiabats. Does it lean more (unstable air, the bubbles accelerate) or less (stable air, they run out of steam)? Every kink marks a change of layer.
3. The inversions: any segment where T heads to the right as it rises. These are the potential ceilings. Look at what Td does above them: if the inversion sits on the ground in the morning, it is nocturnal; if it is aloft with very dry air above it, it is a subsidence inversion (chapter 3); if it is aloft with air that gets moister, it is a frontal inversion, a sign of deterioration (chapter 4).
Your turn — reading by eye
On an 08:00 sounding, T and Td are stuck together (a spread of less than 2 °C) from the ground up to 1,500 m, then abruptly move 15 °C apart above that, where T heads to the right. What does this single clue tell you about the morning?
Show the answer
A moist layer, saturated or nearly so, 1,500 m deep, capped by an inversion and very dry air: the signature of a sea of clouds. A grey morning below 1,500 m, bright sunshine above. The question of the day becomes: will the sun burn through the layer, and when? A hiker setting off from a valley floor for a summit at 2,400 m will climb through the cloud, then come out into the sun.
2.2The reference sounding#
To learn the steps, we will work through the whole chapter on a single sounding, a realistic one: a fine July day in a large valley in the southern French Alps. The setting: a valley floor at 700 m, a south-facing launch at 1,500 m, a massif whose ridges peak between 2,500 and 2,800 m. The sounding is the forecast for 08:00 local time at the valley point.
| What the 08:00 sounding shows | Value |
|---|---|
| At the ground (700 m) | T = 13 °C, Td = 9 °C |
| Nocturnal inversion | from the ground to 1,100 m, where T = 17 °C |
| Above | T falls by 0.8 °C / 100 m up to 3,600 m (−3 °C) |
| Upper-level inversion | from 3,600 to 3,800 m, T rises by 4 °C |
| Above 3,800 m | very dry air (T − Td ≈ 18 °C) |
| Ground forecast | Tmax = 26 °C at around 14:00; Td steady at around 9 °C |
| Forecast hourly curve | 08:00 13° · 09:00 16° · 10:00 18° · 11:00 21° · 12:00 23° · 13:00 24.5° · 14:00 26° |
Nothing exotic: the “normal” summer day under a moderate anticyclone. Keep these figures in front of you; step by step, we will draw from them everything a pilot and a hiker want to know.
2.3The method in five steps#
Here is the complete routine, to be repeated until it becomes automatic. It takes up the bubble method from chapter 1, in the order of a flying morning: 1 the trigger temperature, 2 the base, 3 the top and the ceiling, 4 the depth and the strength, 5 the risks.
Step 1 — the trigger temperature
In the morning, the air at ground level is colder than the air above it: during the night, the ground radiated its heat towards the sky and cooled the layer in contact with it. This is the nocturnal inversion, a lid placed on the valley. As long as it is there, a bubble warmed at the ground rises a few tens of metres, finds itself colder than the air around it, and sinks back.
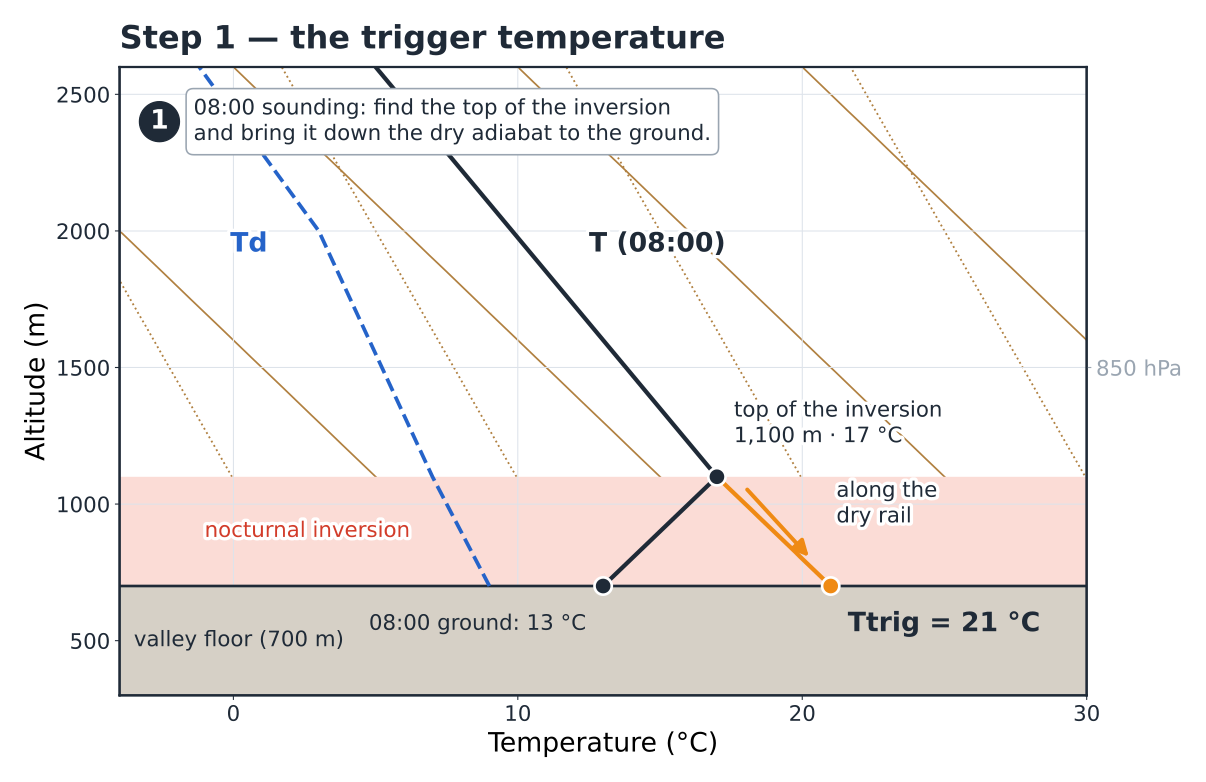
The step (Fig. 2.2): put your finger on the top of the inversion (1,100 m, 17 °C) and go back down to the ground along the dry adiabat. You lose 400 m, so you gain 4 °C: 21 °C. This is the trigger temperature. A bubble leaving the ground at 21 °C reaches the top of the inversion at 17 °C, as warm as the air: it gets through. Any warmer bubble gets through easily.
The hourly curve reaches 21 °C at around 11:00: these are the first thermals in the valley. Finally, gauge the margin of the day, Tmax − Ttrig = 26 − 21 = 5 °C: a classic day. Less than 2 °C, and it will be sluggish, late and short; more than 6 °C, and it will start early and last.
In flight — when to launch
The hourly curve describes the valley. A south-facing launch at 1,500 m, on a rocky slope in the sun since 08:00, often triggers its own bubbles half an hour to an hour earlier, but these first cycles are narrow and choppy. Above all, the calculation saves you from the opposite mistake: taking off at 10:00 on a day when the valley won’t reach 21 °C until 11:00, and landing after ten minutes.
Step 2 — the cumulus base
Now follow the afternoon bubble, leaving the ground at the maximum temperature. As it rises, it cools by 1 °C every 100 m. Its vapour content doesn’t change, but its dew point falls slowly, by about 0.2 °C per 100 m, because the air expands. The gap between the two therefore closes by 0.8 °C every 100 m. When it reaches zero, the vapour condenses: that is the cumulus base.
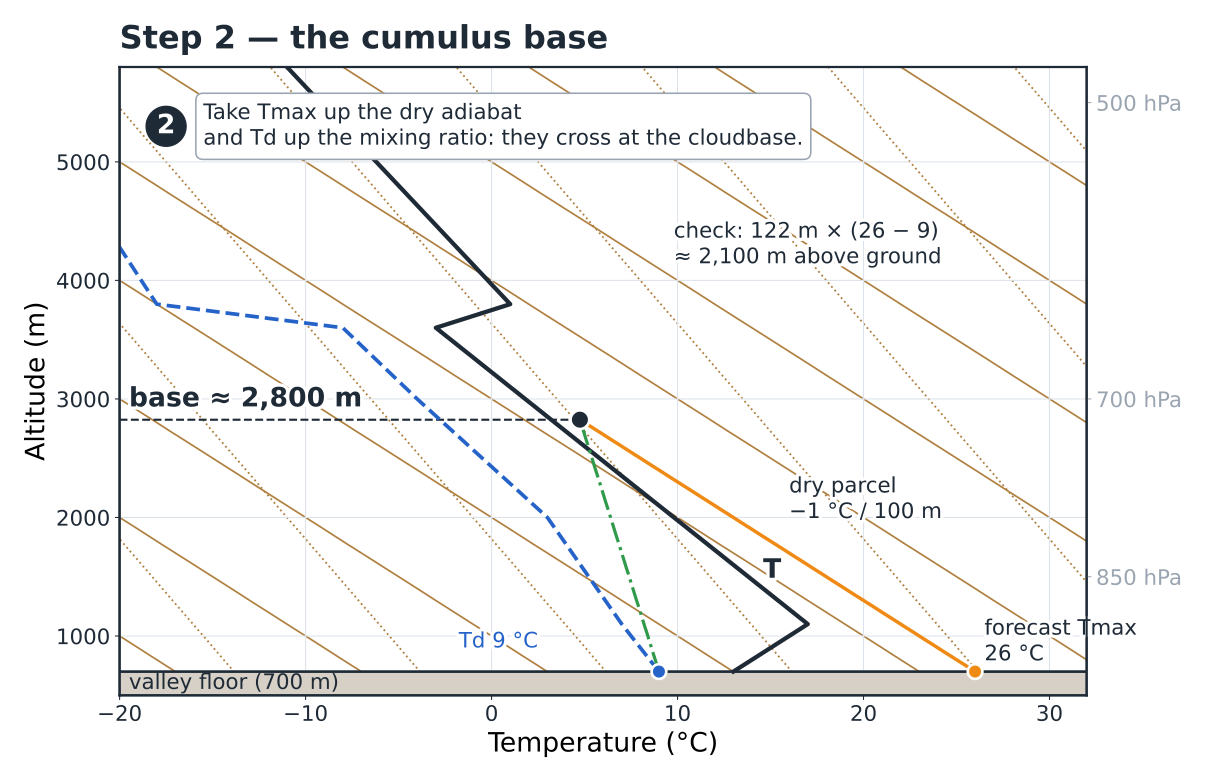
On the emagram (Fig. 2.3): start from Tmax = 26 °C at the ground and climb along the dry adiabat; start from Td = 9 °C and climb along the mixing-ratio line. The two tracks cross at about 2,800 m: the condensation level, the cumulus base. Check: 122 m × (26 − 9) ≈ 2,100 m above the ground, i.e. an altitude of 2,800 m. If your reading differs from this by more than a few hundred metres, look for the mistake.
Which Td should you use?
The dew point at the ground varies less than the temperature, but it does vary: it often falls by 1 to 3 °C in the middle of the day, when mixing blends the air near the ground with drier air from above. Use the Td forecast for the afternoon if it is given. One degree of error in Td means 120 m of error in the base.
Step 3 — the cloud tops and the ceiling
Above the base, the bubble is in its own cloud. Condensation releases heat (the latent heat of chapter 1) and slows its cooling: it now loses only 0.5 to 0.6 °C per 100 m, and keeps rising as long as it stays warmer than the air around it.
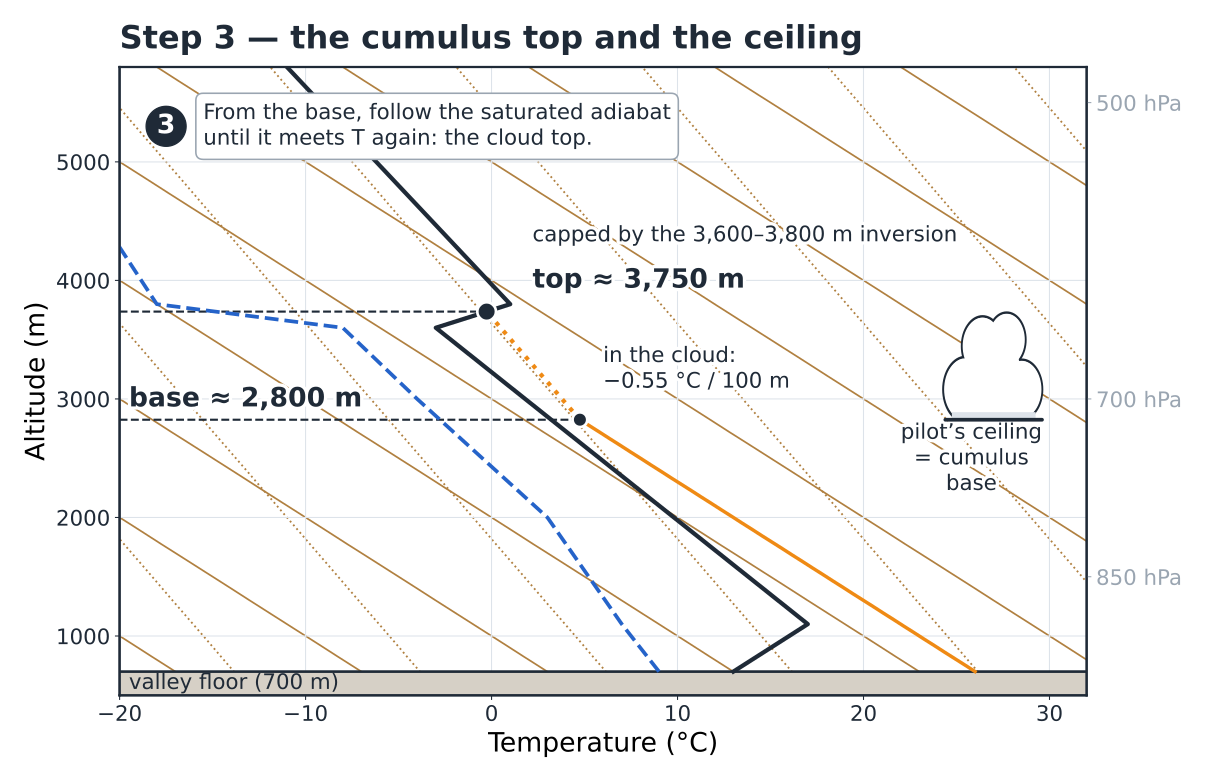
The step (Fig. 2.4): from the base point, follow the saturated adiabat until it crosses the environment curve again. Here, the bubble runs into it at about 3,750 m, in the 3,600–3,800 m inversion: the top of the cumulus. For the pilot, the usable ceiling is the base: you don’t climb into the cumulus. If the dry adiabat had cut T before meeting the mixing-ratio line, there would have been no cloud: that is the blue day, and the ceiling is the height of that intersection.
In flight — the base is not a wall
Under an active cumulus, the lift often speeds up in the last 200 metres, and visibility collapses within seconds as you enter the cloud. Set yourself a personal ceiling 150 to 300 m below the base, and set off on glide rather than circling up into the white.
Step 4 — the depth of the clouds and the strength of the thermals
Two measurements, two questions. The depth of the clouds (top − base) tells you whether it might rain. The strength of the thermals can be read from the gap between the bubble and the air around it: the warmer the bubble compared with its environment, the lighter it is, and the more it accelerates.
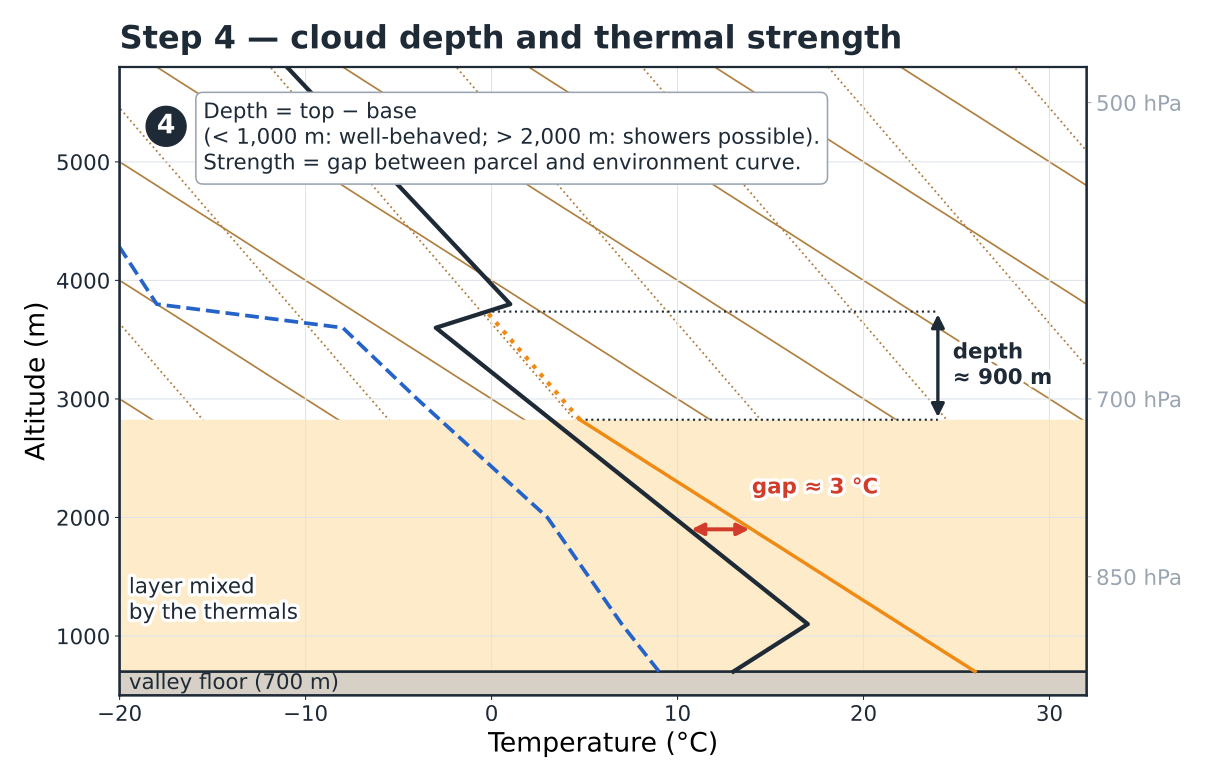
On our sounding (Fig. 2.5), the depth is about 900 m: cumulus humilis to mediocris, no showers possible.
| Cumulus depth | What you see |
|---|---|
| less than 1,000 m | flat or medium cumulus, fine weather |
| 1,000 to 2,000 m | building cumulus, wide shadows, keep an eye on them |
| more than 2,000 m | congestus, showers possible; above 3,000 to 4,000 m, thunderstorms possible |
For the strength, measure the horizontal gap between the bubble and the environment curve in the middle of the convective layer: here, at 1,900 m, about 3 °C. A textbook benchmark, as typical values: 1 °C, gentle thermals (around 1 m/s); 2 to 3 °C, a good day (2 to 3 m/s); more than 4 °C, strong thermals. A second clue: the deeper the mixed layer, the wider and more powerful the thermals. Chapter 8 will refine this with the convective velocity.
Why is the gap read on the morning sounding?
Because in the afternoon, the thermals themselves have mixed the layer: the environment curve there hugs the dry adiabat, and the gap looks almost zero. The morning sounding measures the “relief” that the sun will have to flatten; the bigger it is, the more vigour the thermal engine will have.
Step 5 — the risks: what could go wrong?
A good forecaster doesn’t stop at the answer; they ask how far off it could be. Three questions, always the same ones.
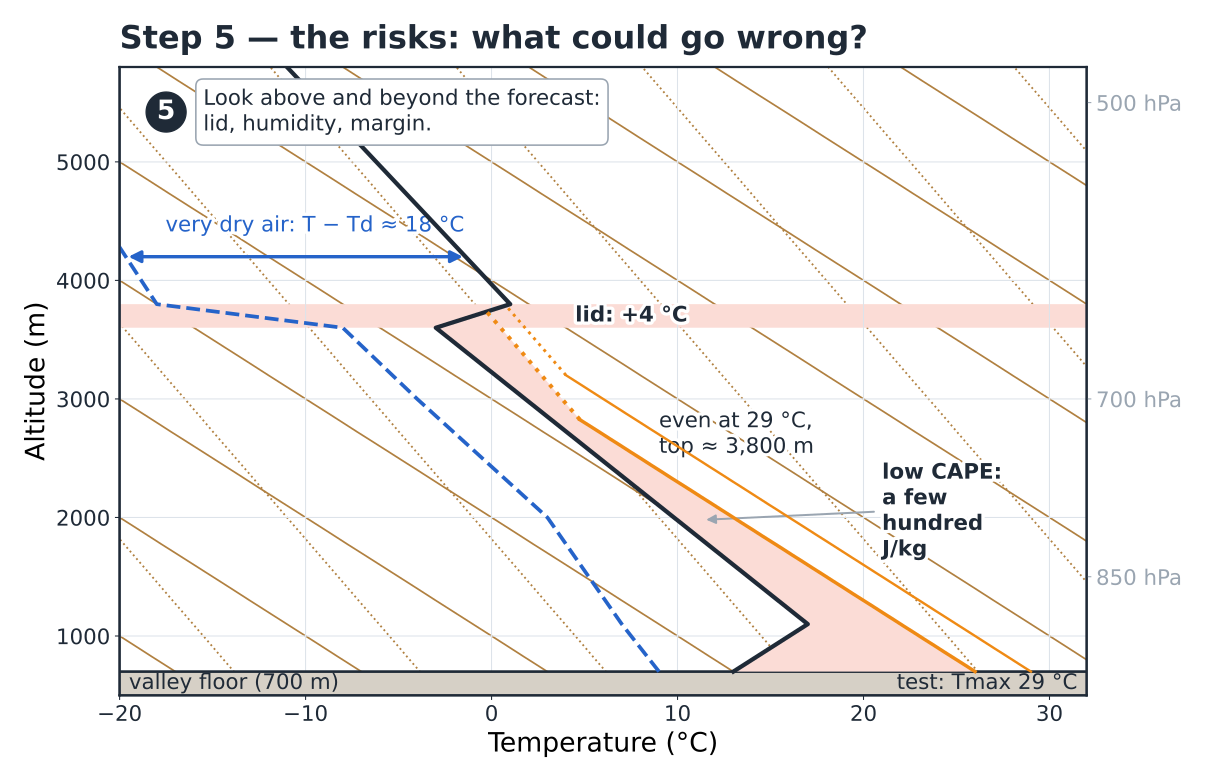
What is above the top? Here, a clear-cut lid (a 4 °C inversion over 200 m) and very dry air: a cumulus that spilled over it would evaporate at once. And if the day warms up more than forecast? Repeat steps 2 and 3 with Tmax + 3 °C (Fig. 2.6): the base rises to 3,200 m, the top stays at about 3,800 m. The lid holds. Is there any energy in reserve? The area between the bubble and the environment curve stays small (a CAPE of a few hundred J/kg): fair-weather convection.
The verdict fits on one line: first thermals at around 11:00, first cumulus at around 13:00 at 2,600 m, base at about 2,800 m in the afternoon, flat to medium cumulus, no risk of thunderstorms. Five minutes with a pencil.
Hiker’s reflex — the same sounding, put to another use
Cumulus base at 2,800 m: the ridges at 2,600–2,800 m will be brushed, or even capped, by the afternoon clouds — no view from the summit, but no rain (900 m deep). No thunderstorms: the lid holds even at +3 °C. The only thing to keep an eye on: the heat on climbs exposed to the south.
2.4The inversion erodes: the day’s timetable#
Step 1 gives you a time; let’s see what happens in the meantime. The sun warms the ground, the ground warms the air in contact with it, and each bubble mixes the layer carrying it a little more. The mixed layer deepens, and the nocturnal inversion disappears from underneath, like a slab of ice melting on a camping stove (Fig. 2.7).
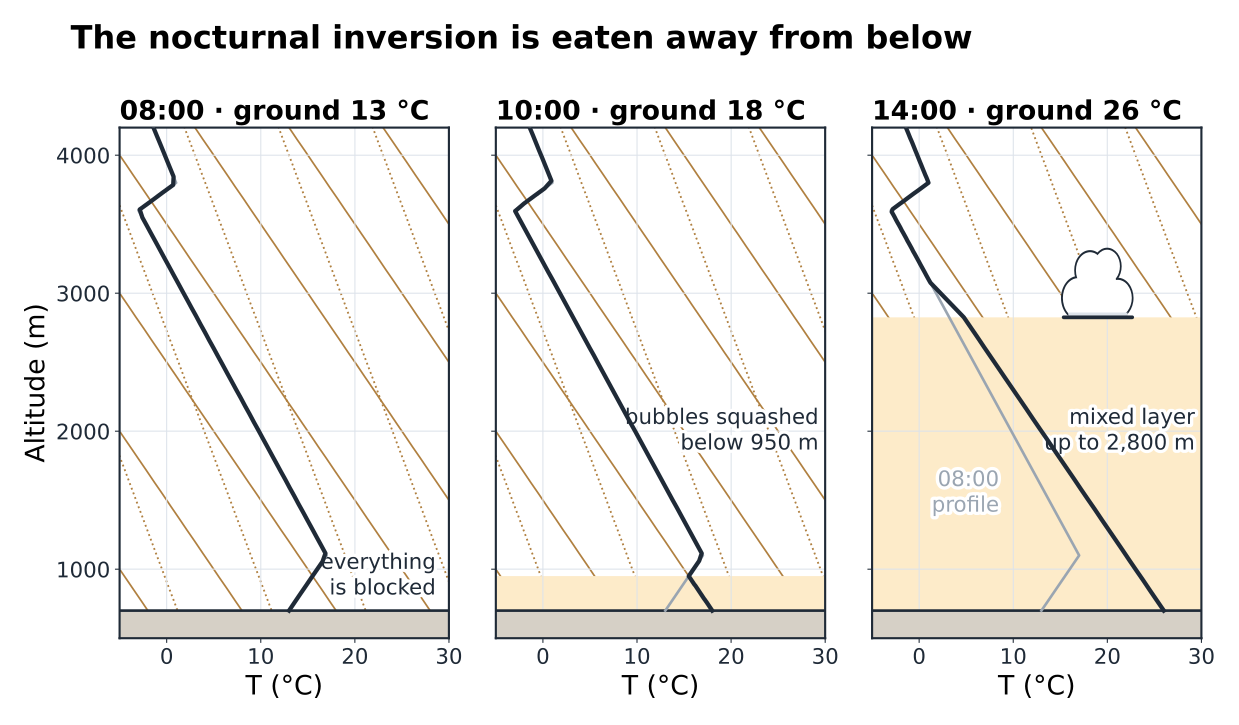
Follow the hours. At 08:00, nothing moves. At 10:00, with 18 °C at the ground, the mixed layer only reaches 950 m: a few weak bubbles on the valley floor, nothing at launch. At around 11:00, 21 °C: the inversion is broken. At around 11:30, 22 °C: the mixed layer goes above 1,600 m, and launch is in play. At around 13:00, 24.5 °C: the bubbles reach their condensation level, and the first cumulus are born at around 2,600 m. By 14:00, the base has settled at about 2,800 m.
The upper-level inversion, on the other hand, does not erode: it is maintained from above, by air that sinks and warms as it is compressed (chapter 3). The thermals reach it in the afternoon but rarely break through it: it is what makes the “concrete” ceilings of fine anticyclonic days.
Pitfall of the 12:00 UTC sounding
A forecast sounding is valid for a given time. The 12:00 UTC one (14:00 local time in summer; UTC + 1 in the UK) shows a low layer that is already mixed, lying along the dry adiabat: that is not a mistake, it is the trace of the thermals. For the trigger time, work on the morning sounding; for the afternoon base, the 12:00 or 15:00 UTC sounding can be read directly, where the dry layer meets the moist layer.
Your turn — the timetable
Morning sounding: nocturnal inversion up to 600 m above the ground, temperature at its top 16 °C. Hourly curve at the ground: 09:00 15 °C, 10:00 17 °C, 11:00 19 °C, 12:00 20.5 °C, 13:00 21.5 °C, 14:00 23 °C (Tmax). Give the trigger temperature, the time of the first reliable thermals and the margin of the day.
Show the answer
Bring the top of the inversion back down 600 m along the dry rail: 16 + 6 = 22 °C, reached between 13:00 and 14:00. Margin: 23 − 22 = only 1 °C. Verdict: a late, sluggish day, with a usable window from about 14:00 to 16:30, and weak thermals. Thirty seconds of calculation save three hours of waiting at launch.
2.5CAPE and CIN: the toll and the fuel#
The method gives the heights; the areas give the energy. Between the bubble’s path and the environment curve, two areas take shape (Fig. 2.8). Think of a car that has to get over a speed bump before a long downhill: first you have to put in some effort (the toll), then everything happens on its own (the fuel).
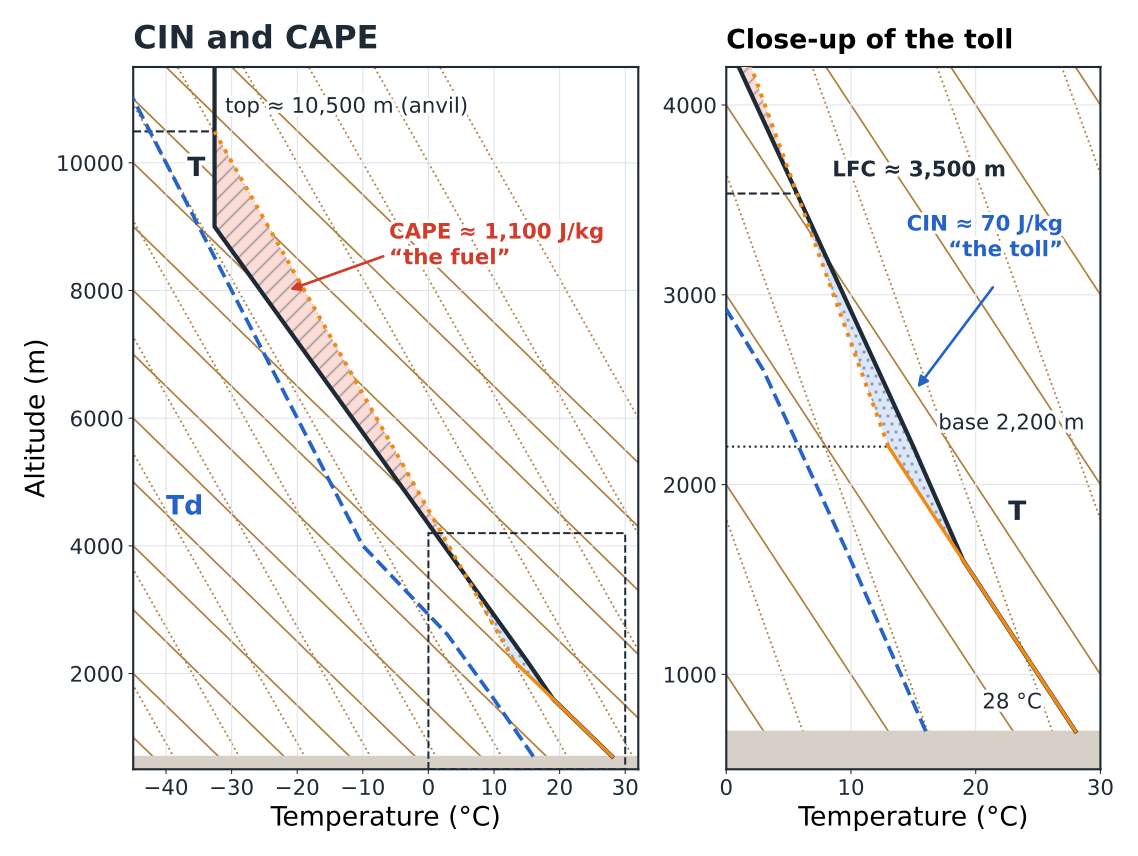
The CIN is the area where the bubble is colder than the air, below the level of free convection: the lid, put into numbers. A few J/kg: nothing holds it back, and convection starts early. A few tens to a hundred J/kg: a lock that gives way during the day if the sun heats enough. Above 100 to 200 J/kg: a lid that often holds all day.
The CAPE is the area where the bubble is warmer than the air: the fuel once convection is under way.
| CAPE | In the mountains in summer |
|---|---|
| less than 500 J/kg | fair-weather convection, cumulus |
| 500 to 1,000 J/kg | strong thermals, congestus likely |
| 1,000 to 2,500 J/kg | real thunderstorm potential |
| more than 2,500 J/kg | potentially violent thunderstorms (hail, gusts) |
The maximum theoretical vertical speed is w = √(2 · CAPE): 1,100 J/kg gives 47 m/s, of which a real current of roughly half remains once mixing and the weight of the water are taken off. That is typical of the updraughts under and inside a cumulonimbus, twenty times the sink rate of your wing: you are never “a good enough pilot” to fly near a thunderstorm.
The pair that should make you call it off
High CAPE and moderate CIN that holds in the morning: a deceptive blue sky until midday, while the atmosphere charges its capacitors. The lid gives way all at once in the early afternoon and all the energy goes in a single burst. This is the typical scenario of summer thunderstorm accidents in the mountains, for the pilot as for the hiker still on a ridge at 15:00 (chapter 9).
In flight — CAPE and timing
CAPE below 500 J/kg with a lid: fly freely. Between 500 and 1,000: fly, but keep your distance from building cumulus. Above 1,000 with a CIN that gives way around midday: fly early, land early, and from 13:00 onwards treat every congestus as a thunderstorm in the making.
2.6The wind, on the side of the sounding#
On the right-hand side of almost every emagram, a column of small flags gives the wind at each level: the wind barbs (Fig. 2.9). The shaft points to where the wind comes from; the barbs at its end give the speed in knots: half barb 5 kt, barb 10 kt, pennant 50 kt (1 kt ≈ 1.85 km/h).
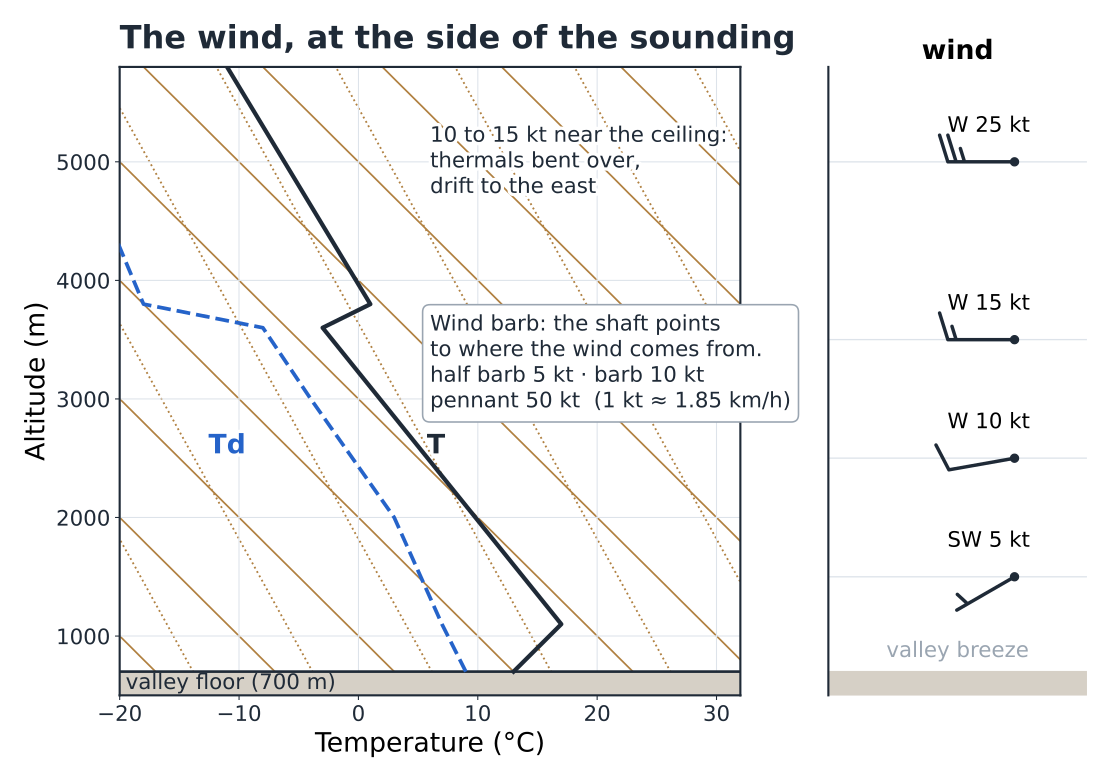
Three useful readings. The wind at ridge level (here 10 kt from the west at about 2,500 m): it tells you which faces will be windward and which leeward. The wind at the ceiling: above 15 to 20 kt, thermals lie over and break up, and become hard to centre. Wind shear: an abrupt change of direction or strength between two levels signals a turbulent zone, often at the top of the mixed layer.
In flight — from wind barb to launch
The wind on the sounding is the free-air wind. At launch, it is slowed, deflected by the terrain and drowned in the breeze (chapters 3, 6 and 7). A sounding that gives 10 kt from the west at 2,500 m over a south-facing launch at 1,500 m means: a southerly breeze at launch, but a westerly component as soon as you climb above the ridges, and a wind shadow behind every ridge running north–south.
2.7The ceiling over launch, the ceiling over the massif#
Here is the nuance that separates someone who can read an emagram from a cross-country pilot. The sounding describes the air above one point — often the valley floor where launch is. But in the afternoon, you fly over a massif.
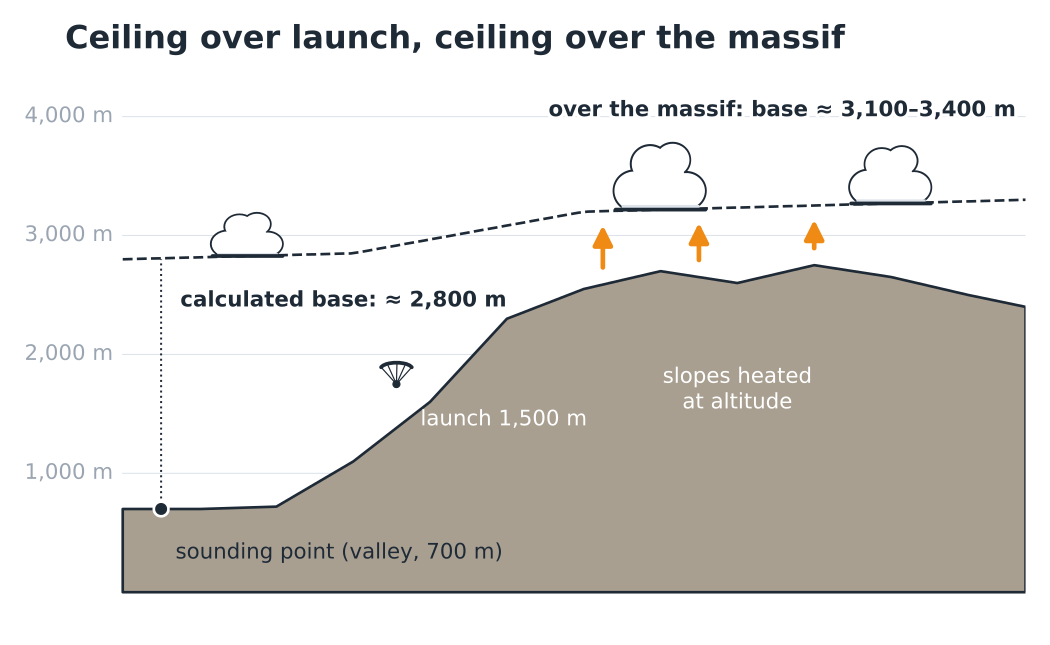
A large sunny massif is a stove set up at altitude. At 2,600 m, the air in contact with the rocky slopes is clearly warmer than the free air at the same level above the valley. The bubbles that leave from there start higher and warmer; the mixed layer deepens above the terrain, and the base with it (Fig. 2.10). On top of that comes a model effect: the computational grid smooths the terrain, and the “valley” point knows nothing of the real ridges. The result: a valley-floor profile clearly underestimates the ceiling over a large massif, often by 300 to 800 m in summer, sometimes more.
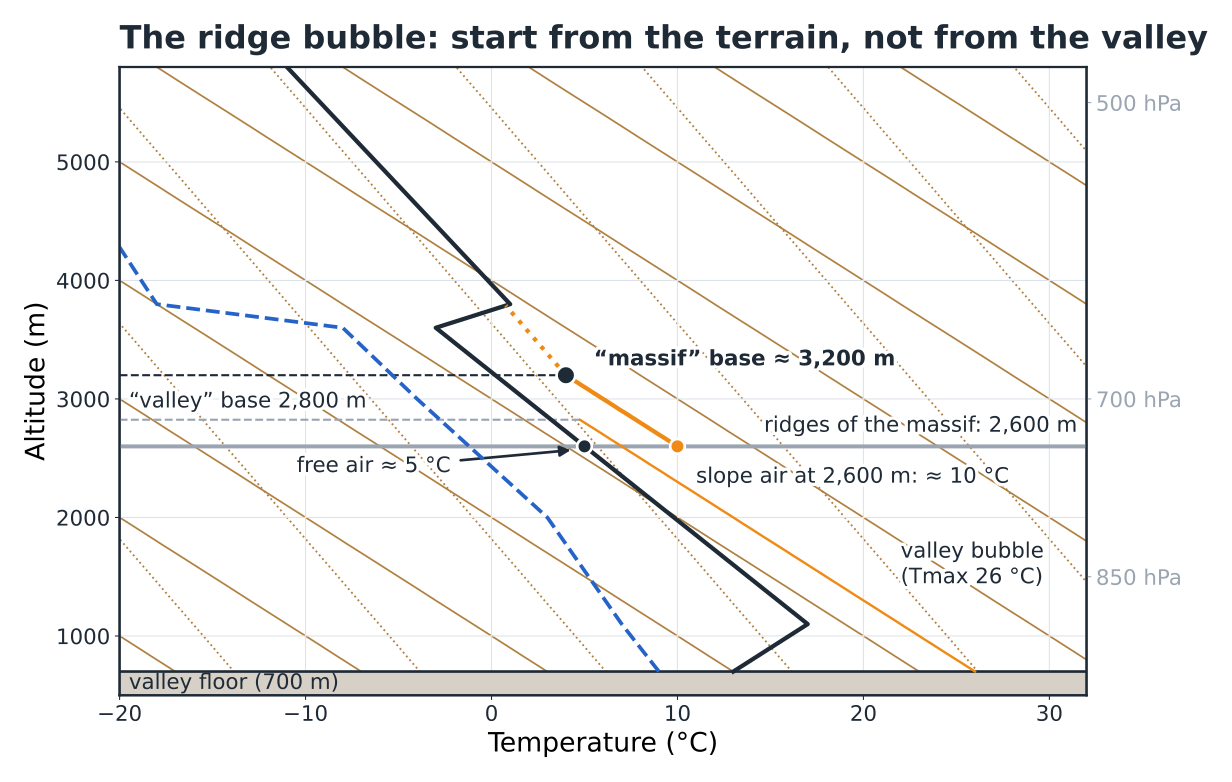
The ridge-bubble method takes this into account (Fig. 2.11). Put yourself at ridge height. Starting temperature: that of the air in contact with the sunny slopes — failing a measurement, the free air at that level plus 3 to 6 °C on a summer afternoon; a summit wind station is better than an estimate. Dew point: the one carried at that height by the mixing-ratio rail that starts from the valley Td. Repeat steps 2 and 3 from this point: here, 10 °C at 2,600 m gives a base at about 3,200 m.
Don’t overdo it
The ridge bubble is an estimate: how much the slopes overheat depends on their aspect, the ground, the time of day and the wind. And the lid doesn’t move: an inversion that caps convection at 3,800 m above the valley caps it above the massif too. The gain is in the base, not in the top. Treat the “massif” base as a range, and calibrate it against your own flights (the log in chapter 10).
In flight — choosing the right sounding point
On websites where you can click anywhere on the map, open two soundings: one for launch and one for the heart of the massif you will cross. The difference between the two bases is information in itself. In the morning, look at where the first cumulus form: almost always over the highest, best-exposed ridges, and higher than over the valley.
Your turn — the glide over the ridges
The sounding for the valley point (650 m) gives a base at 2,300 m. Your cross-country route crosses a line of ridges at 2,400 m. Should you call it off?
Show the answer
Not necessarily, but not on the strength of the valley sounding alone. Above the ridges, the base will probably be a few hundred metres higher, with no guarantee. Three checks: the sounding for a point on the massif; the height of the first cumulus over the ridges during the morning; and, in flight, the base actually reached before the glide. Have a Plan B: a fallback line and a landing field within reach if the ceiling stays below 2,700 m at the foot of the crossing.
2.8Four typical profiles#
With the method in hand, almost all summer soundings come down to a few families. Learn them like faces (Fig. 2.12).
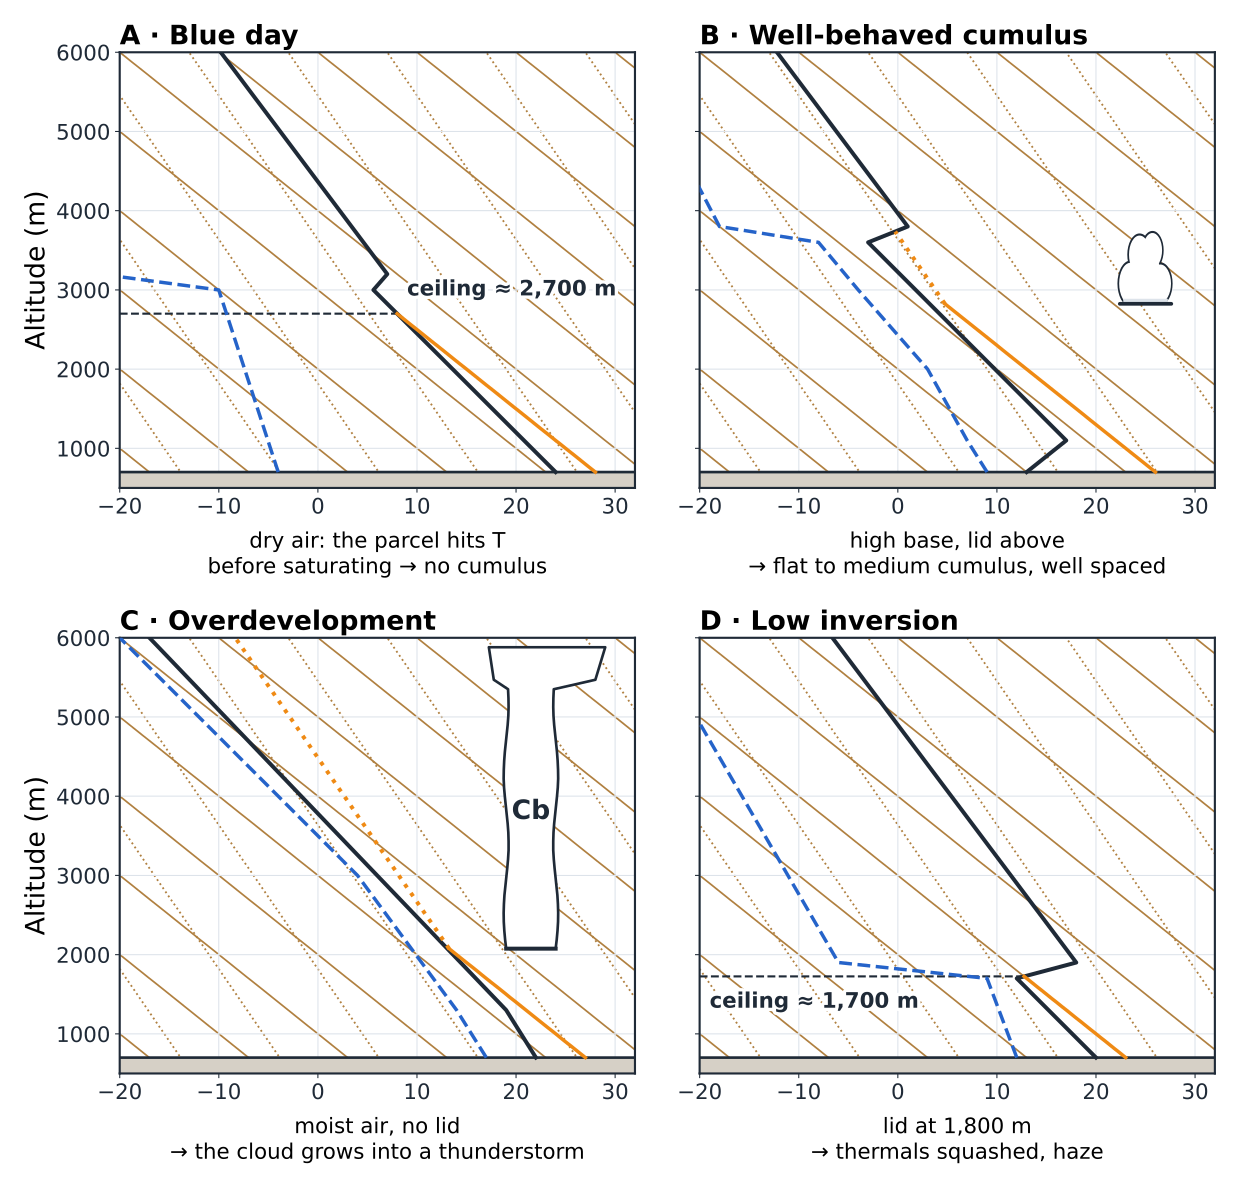
| Profile | Signature | The day |
|---|---|---|
| A. Blue day | T − Td of more than 15 to 20 °C; the dry adiabat cuts T before the mixing-ratio line | Thermals with no markers, a sharp ceiling; demanding navigation (chapter 8) |
| B. Well-behaved cumulus | Lapse rate of 0.7 to 0.9 °C / 100 m over 2,000 m or more, a lid above, T − Td of 4 to 10 °C below this lid on the morning sounding, low CAPE | Flat to medium cumulus, high base, clean thermals: the cross-country day |
| C. Overdevelopment | High Td (more than 14 °C in the valley), moist air aloft, no lid, CAPE of more than 1,000 J/kg | A good start, then congestus as early as 12:00–14:00, thunderstorms: fly early, land early |
| D. Low inversion | A clear-cut subsidence inversion below 2,000 m (at about 1,700–1,900 m in Fig. 2.12); below it, the lapse rate can be as good as in B: it is the low lid that decides | Low ceiling, haze, stunted thermals: evening ridge soaring or nothing |
A fifth face can be recognised without any calculation: the grey murk, T and Td stuck together through a deep layer under a stable lapse rate. Stratus or stratocumulus, no useful convection, ridges in cloud.
Your turn — classify without calculating
A July sounding, 08:00: at the ground 21 °C and Td 18 °C, T and Td 3 to 5 °C apart up to 3,500 m, lapse rate 0.75 °C / 100 m, no significant inversion, forecast CAPE 1,400 J/kg, CIN 40 J/kg. Which profile, and what decisions for a flight, then for a hike that crosses a ridge at 2,800 m?
Show the answer
Profile C, overdevelopment: very high Td, moisture through the whole column, high CAPE, moderate CIN that will give way in late morning, no lid. Flying: launch as soon as it triggers, landing planned before 13:00, constant watch on the congestus. Hiking: ridge crossed in the morning, back down below 2,000 m before 13:00–14:00, fallback route identified. The same sounding gives both decisions.
Hiker’s reflex — translating the profiles
A: settled fine weather, heat, hydration; no clouds to signal a change. B: ideal hiking, with cumulus sometimes catching the highest summits in the afternoon. C: a morning outing only. D: summits above the inversion often in the sun above the haze; compare the height of the lid with that of your summits. Grey murk: an outing in the forest or on the valley floor.
2.9Where to find forecast soundings#
There are two families. Radiosonde soundings are real measurements, launched at fixed times (00:00 and 12:00 UTC) from a few stations; around the southern French Alps, the nearest are, for example, Nîmes, Lyon, Payerne (Switzerland) or Cuneo (Italy). They describe the real air, but far from your site and at fixed times. Forecast soundings are calculated by the models, for every hour and any point: these are the ones you will use day to day.
| Source | What you find there |
|---|---|
| Météo-Parapente | A French paragliding forecast website: a forecast emagram for the point you click on the map, hour by hour, with the wind; ideal for comparing launch and the massif |
| Meteociel | A French weather website: forecast soundings from several models (AROME, the high-resolution model of Météo-France, the French national weather service, with a grid of about 1.3 km; ARPEGE, its global model; GFS, the US global model…) and access to real radiosonde soundings |
| Mountain bulletins, wind stations | The freezing level and the summit wind (Météo-France’s mountain bulletin is written by a forecaster for each massif), and the real measurements used for cross-checking |
Four precautions. The time: soundings are often in UTC; add 2 h in summer (12:00 UTC = 14:00 local time), 1 h in winter. The point: check the model’s ground elevation, which can differ from the real terrain by several hundred metres. The model: two models that disagree on Tmax or on the humidity aloft signal an uncertain day. Cross-checking: in the morning, compare the forecast with reality — temperature at 08:00, first cumulus, high-level veil. A sounding that got 08:00 wrong will get 15:00 wrong.
In flight — the routine
The day before: the 14:00 sounding for launch and for the massif, the five steps, the typical profile. In the morning: the updated 08:00 sounding, Ttrig and take-off time, a glance at the sky. At launch: compare the base of the first cumulus with the forecast base, and correct the rest of the day accordingly.
2.10The hiker’s sounding#
Rain, visibility, thunderstorms: the hiker’s questions can be read on the same emagram, in this order.
Where will the base be? (visibility)
Calculated base against the height of the route. Below it: clear views. Above it: in cloud as soon as the cumulus form.
Does the moist layer cling to the terrain?
T and Td close together through a deep layer, and a wind pushing the moist air against the slope: the windward slope will be in cloud lower than the calculated base.
How deep are the clouds? (showers)
Less than 2,000 m: no convective showers. More than that: showers possible, and thunder joins in when the CAPE exceeds 800 to 1,000 J/kg.
When does it turn bad?
Trigger, CIN and the hourly curve give the time at which the lid breaks. Ridges are crossed in the morning; take your margin on the timing, not on the route.
Hiker’s reflex — the cold on the summit
The emagram also gives the free-air temperature at the summit: on our sounding, 5 °C at about 2,600 m in the morning, barely more in the afternoon. With 20 km/h of wind on the ridge, the feels-like temperature approaches 0 °C. A warm layer in the rucksack, even in July.
2.11Quick reference and summary#
The chapter’s key figures
| Dry adiabat | −1 °C / 100 m |
| Saturated adiabat | ≈ −0.55 °C / 100 m (0.4 to 0.8) |
| Dew point of the bubble | ≈ −0.2 °C / 100 m |
| Cumulus base above ground | ≈ 122 m × (T − Td) |
| Pressure benchmarks | 850 hPa ≈ 1,500 m · 700 ≈ 3,000 · 500 ≈ 5,500 |
| Margin Tmax − Ttrig | < 2 °C sluggish · 3–5 classic · > 6 early |
| Strength (bubble − environment gap, mid-layer) | 1 °C gentle · 2–3 good · > 4 strong |
| Cumulus depth | < 1,000 m well-behaved · > 2,000 m showers |
| CAPE (J/kg) | < 500 fine weather · > 1,000 thunderstorms · > 2,500 violent |
| CIN (J/kg) | a few units: nothing · tens to 100: lock · > 100–200: lid |
| Theoretical vertical speed | w = √(2 · CAPE) |
| Base above a large massif | often + 300 to 800 m / valley |
| Wind barbs | barb 10 kt · 1 kt ≈ 1.85 km/h |
| Sounding times | 12:00 UTC = 14:00 local time in summer |
What to remember
- An emagram is two curves of the day (T, Td) laid over fixed rails; each step uses only two lines.
- First, three readings by eye: the T − Td spread, the slope of T, the inversions.
- The five steps: trigger, base, top and ceiling, depth and strength, risks.
- The nocturnal inversion erodes from below and sets the timetable; the subsidence inversion holds and sets the ceiling.
- CIN = toll, CAPE = fuel: high CAPE with a CIN that holds in the morning means an afternoon thunderstorm.
- Wind barbs: the shaft points to where the wind comes from; one barb is worth 10 kt.
- A valley sounding underestimates the base over a large massif; the ridge bubble gives a range for it.
- Four summer faces: blue, well-behaved cumulus, overdevelopment, low inversion (plus the grey murk).
- A forecast sounding must always be cross-checked against the morning sky.
Chapter glossary#
- Dry adiabat
- Cooling rail of a rising unsaturated bubble: −1 °C / 100 m, the effect of expansion alone.
- Saturated adiabat
- Rail of the bubble inside its cloud: ≈ −0.55 °C / 100 m (0.4 in warm air to 0.8 in cold air). Condensation releases heat, which slows the cooling.
- Mixing ratio
- Rail of the dew point of a bubble that rises without gaining or losing vapour: ≈ −0.2 °C / 100 m.
- Environment curve
- The real (measured or forecast) profile of temperature with altitude on that day. It follows no rail.
- Dew point
- Temperature to which the air would have to be cooled to saturate it. The T − Td spread measures the distance from saturation.
- Bubble method
- Following an ideal bubble along its rails and comparing it with the environment curve to forecast the base, the top, the ceiling and the strength.
- Trigger temperature
- Temperature the ground must reach for a bubble to break through the nocturnal inversion: the top of the inversion brought back down to the ground along the dry adiabat.
- Condensation level
- Height at which the rising bubble saturates: the cumulus base, about 122 m × (T − Td) above the ground.
- Ceiling
- Maximum usable height in thermals: the cumulus base or, on a blue day, the height at which the dry bubble meets the environment curve.
- Blue day
- Day on which the air is too dry for the bubble to saturate before reaching its ceiling: real lift, with no cumulus to mark it.
- Level of free convection (LFC)
- Height above which the bubble becomes warmer than the air and rises unaided.
- CIN (convective inhibition)
- Energy that must be supplied to the bubble for it to reach the LFC (J/kg): the toll.
- CAPE
- Convective available potential energy (J/kg): the area where the bubble is warmer than the air; the fuel for lift, and for thunderstorms above about 1,000 J/kg.
- Nocturnal inversion
- Layer resting on the ground in which temperature increases with height, created by the ground cooling at night; destroyed from below during the morning.
- Wind barb
- Wind symbol: the shaft points to where the wind comes from; barb 10 kt, half barb 5 kt, pennant 50 kt.
- Ridge bubble
- Bubble launched from ridge height with the temperature of the air over the sunny slopes, to estimate the base over a massif.
End of chapter 2. Chapter 3 leaves the vertical for the large scale: why the air goes round lows, and where that subsidence lid you can now read comes from.